

Mathematics, 30.03.2021 22:10, zalbesifki12
The double dot plot shows the values in two data sets. Express the difference in the measures of center as a multiple of the measure of variation.
Double dot plot shows values of two data sets. It shows the following values that appear as dots above the line. For data set A. One dot above 30. Two dots above 35. Three dots above 40. Three dots above 45. Two dots above 50. One dot above 55. For data set B. Three dots above 10. One dot above 15. Four dots above 20. One dot above 25. Three dots above 30.
The difference in the means is about _
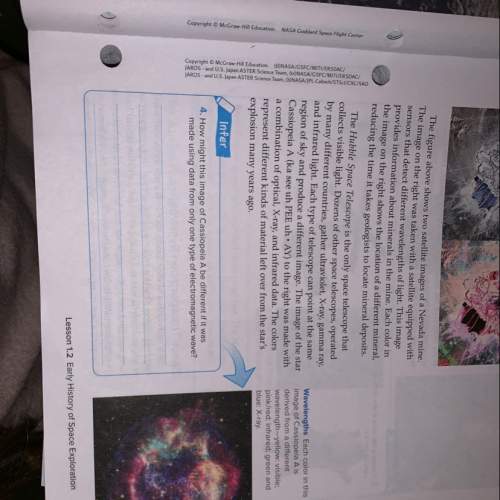
times the MAD.

Answers: 2


Other questions on the subject: Mathematics
Mathematics, 22.06.2019 00:30, vladisking888
How can you find the magnitude of a vector, v = < x, y > , where the horizontal change is x and the vertical change is y?
Answers: 1
Do you know the correct answer?
The double dot plot shows the values in two data sets. Express the difference in the measures of cen...
Questions in other subjects:

Health, 10.10.2021 22:10
Mathematics, 10.10.2021 22:10

Mathematics, 10.10.2021 22:10
English, 10.10.2021 22:10
Mathematics, 10.10.2021 22:10

Chemistry, 10.10.2021 22:10
Mathematics, 10.10.2021 22:10
Mathematics, 10.10.2021 22:10


