

Mathematics, 30.03.2021 17:40, billydeck30
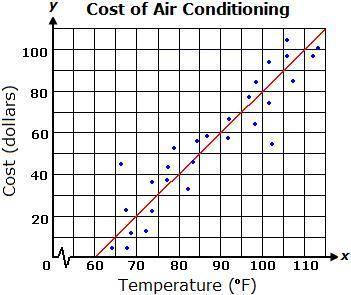
The graph shows a line of best fit for data collected on the cost of air conditioning as a function of the outside temperature.
Which equation represents the line of best fit?
A. y=2x-60
B. y=x-120
C. y=2x-120
D. y=x-60

Answers: 1


Other questions on the subject: Mathematics
Mathematics, 21.06.2019 17:00, DivineMemes420
100 points, hi, i’m not sure what to do here, the data doesn’t seem to be quadratic .? can anyone me, in advance
Answers: 2
Mathematics, 21.06.2019 21:50, quennnshyan7276
Which graph depicts the path of a projectile
Answers: 1
Mathematics, 21.06.2019 22:30, emmanuelmashao5504
Given that y varies directly to the square root of (x + 1), and that y = 1 when x = 8,(a)express y in terms of .x,(b)find the value of y when x = 3,(c)find the value of x when y = 5.
Answers: 1
Do you know the correct answer?
The graph shows a line of best fit for data collected on the cost of air conditioning as a function...
Questions in other subjects:

Mathematics, 19.11.2020 21:00


Mathematics, 19.11.2020 21:00

Computers and Technology, 19.11.2020 21:00


