


Please help me
Will give you
The data shown in the table below represents the weight,...

Mathematics, 30.03.2021 17:20, JANA279
Please help me
Will give you
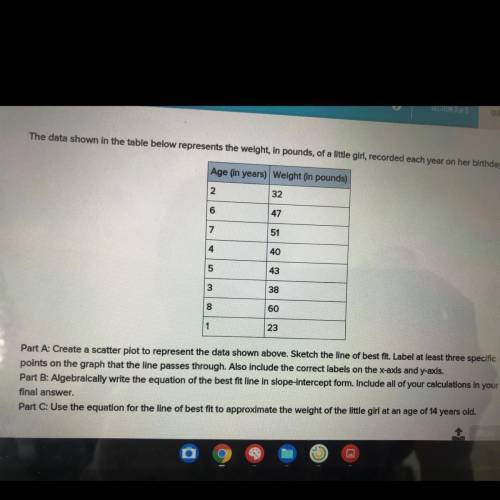
The data shown in the table below represents the weight, in pounds, of a little girl, recorded each year on her birthday.
Part A: Create a scatter plot to represent the data shown above. Sketch the line of best fit. Label at least three specific
points on the graph that the line passes through. Also include the correct labels on the x-axis and y-axis.
Part B: Algebraically write the equation of the best fit line in slope-intercept form. Include all of your calculations in your
final answer.
Part C: Use the equation for the line of best fit to approximate the weight of the little girl at an age of 14 years old.

Answers: 1
Other questions on the subject: Mathematics
Mathematics, 21.06.2019 16:00, amylumey2005
Leo has b boxes of pencils. each box contains 6 pencils. he has a total of 42 pencils. the equation that represents this situation the value of b that makes the equation true the first one is b+6=42,6b=42,b=42+6,or 42b=6 the second one are 7,836 48
Answers: 3
Mathematics, 21.06.2019 19:30, alanaruth3389
Consider a cube that has sides of length l. now consider putting the largest sphere you can inside this cube without any point on the sphere lying outside of the cube. the volume ratio -volume of the sphere/ volume of the cube is 1. 5.2 × 10⁻¹ 2. 3.8 × 10⁻¹ 3. 1.9 4. 2.5 × 10⁻¹ 5. 3.8
Answers: 2
Mathematics, 21.06.2019 20:30, celestesanchezts
8. kelly wants to buy a magazine that is $25. later the magazine was marked up an additional 20%. what is the new price?
Answers: 1
Do you know the correct answer?
Questions in other subjects:


Arts, 14.12.2020 03:40
Social Studies, 14.12.2020 03:40

Mathematics, 14.12.2020 03:40


