

Mathematics, 29.03.2021 23:30, astorkid
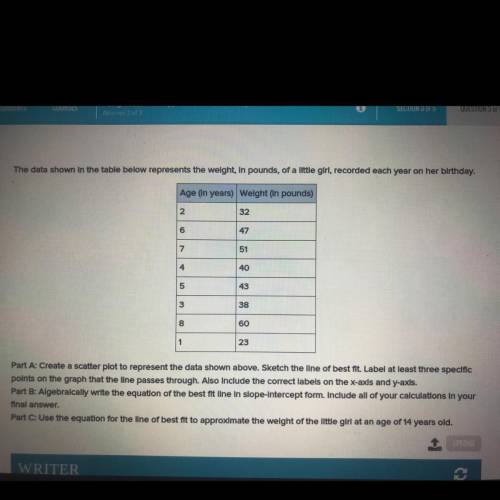
The data shown in the table below represents the weight, in pounds, of a little girl, recorded each year on her birthday.
Age (in years) Weight (in pounds)
2
32
6
09
47
7
51
40
4 5
5
43
3
38
8
00
60
1
23
Part A: Create a scatter plot to represent the data shown above. Sketch the line of best fit. Label at least three specific
points on the graph that the line passes through. Also include the correct labels on the x-axis and y-axis.
Part B: Algebraically write the equation of the best fit line in slope-intercept form. Include all of your calculations in your
final answer.
Part C: Use the equation for the line of best fit to approximate the weight of the little girl at an age of 14 years old.
Please please help me
Please help me. I will give you

Answers: 1


Other questions on the subject: Mathematics
Mathematics, 20.06.2019 18:02, angelinamadriga
Use the numbers in the multiplication equation 45 x 1/9 =5 to write a division equation involving division by a fraction.
Answers: 1
Mathematics, 21.06.2019 20:30, ellie55991
Graph the line that represents a proportional relationship between d and t with the property that an increase of 33 units in t corresponds to an increase of 44 units in d. what is the unit rate of change of dd with respect to t? (that is, a change of 11 unit in t will correspond to a change of how many units in d? )
Answers: 3
Do you know the correct answer?
The data shown in the table below represents the weight, in pounds, of a little girl, recorded each...
Questions in other subjects:


Health, 09.07.2019 06:30

Chemistry, 09.07.2019 06:30


Biology, 09.07.2019 06:30


Social Studies, 09.07.2019 06:30
Biology, 09.07.2019 06:30


