

Mathematics, 29.03.2021 20:30, tyrique86
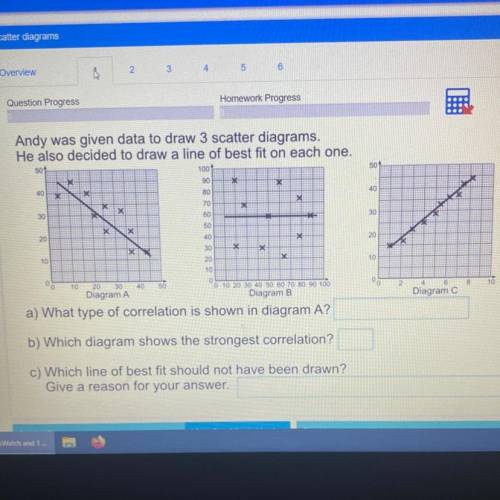
Andy was given data to draw 3 scatter diagrams.
He also decided to draw a line of best fit on each one.
50
100
50
90
*
X
40 5
80
40
EX
X
70
X
F
X
30
60
30
50
X
IX
20
40
X
20
TX
30
*
X
10
20
10
0 0
10
30
40
50
10
0
0 10 20 30 40 50 60 70 80 90 100
Diagram B
00
2
8
10
Diagram C
20
Diagram A
a) What type of correlation is shown in diagram A?
b) Which diagram shows the strongest correlation?
c) Which line of best fit should not have been drawn?
Give a reason for your answer.

Answers: 2


Other questions on the subject: Mathematics
Mathematics, 21.06.2019 14:20, arnold2619
G(x) = 2 sin(2x - π) + 4. using complete sentences, explain how to find the minimum value for the function.
Answers: 3
Mathematics, 21.06.2019 19:10, katy3865
Revirite the formula to determine the area covered by one can of paint. alyssa and her father are going to paint the house this summer. they know they'll need 6 cans of paint. enter the correct answer. 000 done a formula that describes this scenario is (licierali 000 oo 6 w w = the total area of the walls p = area covered by a can of paint
Answers: 1
Mathematics, 21.06.2019 21:00, zwalkert01
If a is a nonzero real number then the reciprocal of a is
Answers: 2
Do you know the correct answer?
Andy was given data to draw 3 scatter diagrams.
He also decided to draw a line of best fit on each...
Questions in other subjects:

English, 09.04.2021 16:20

Mathematics, 09.04.2021 16:20
Mathematics, 09.04.2021 16:20

Social Studies, 09.04.2021 16:20
Mathematics, 09.04.2021 16:20
Mathematics, 09.04.2021 16:20


