

Mathematics, 27.03.2021 17:50, glizbethh00
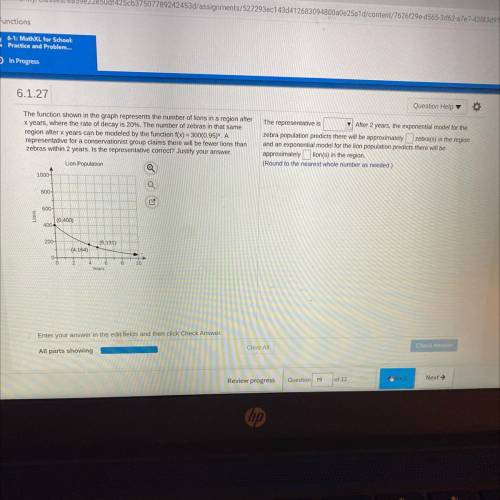
The function shown in the graph represents the number of lions in a region after
x years, where the rate of decay is 2096. The number of zebras in that same
region after x years can be modeled by the function f(x) = 300(0.95). A
representative for a conservationist group claims there will be fewer lions than
zebras within 2 years. Is the representative correct? Justify your answer.
The representative is After 2 years, the exponential model for the
zebra population predicts there will be approximately zebra(s) in the region
and an exponential model for the lion population predicts there will be
approximately lion(s) in the region.
(Round to the nearest whole number as needed.)
Lion Population
20001
Q
800
600
(0.400
400
200
(5.131)
(4.164)
10
Years

Answers: 3


Other questions on the subject: Mathematics
Mathematics, 21.06.2019 13:10, sreeytran
What can be said about the relationship between triangles and circles? check all that apply. a) many circles can be inscribed in a given triangle b) exactly one triangle can be inscribed in a given circle c) exactly one circle can be inscribed in a given triangle d) many triangular shapes can be circumscribed about a given circle
Answers: 1
Mathematics, 21.06.2019 17:00, Niyah3406
When you are making a circle graph by hand, how do you convert a number for a part into its corresponding angle measure in the circle graph? when you are making a circle graph by hand, what should you do if one of your angle measures is greater than 180°?
Answers: 2
Do you know the correct answer?
The function shown in the graph represents the number of lions in a region after
x years, where the...
Questions in other subjects:

Mathematics, 24.02.2021 14:00
English, 24.02.2021 14:00

Biology, 24.02.2021 14:00
Mathematics, 24.02.2021 14:00
Mathematics, 24.02.2021 14:00
Biology, 24.02.2021 14:00


