

Mathematics, 26.03.2021 22:20, agray339
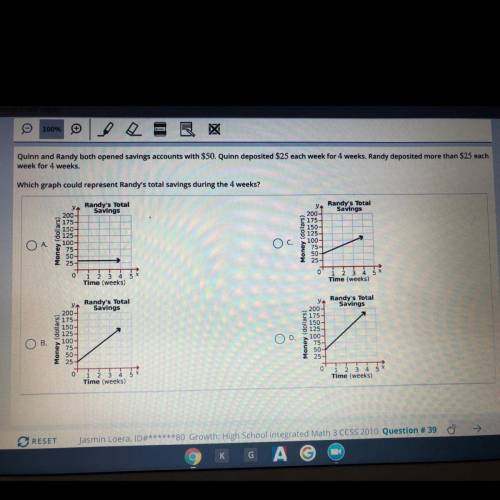
Quinn and Randy both opened savings accounts with $50. Quinn deposited $25 each week for 4 weeks. Randy deposited more than $25 each
week for 4 weeks.
Which graph could represent Randy's total savings during the 4 weeks?

Answers: 2


Other questions on the subject: Mathematics
Mathematics, 21.06.2019 20:30, marahkotelman
Find the nonpermissible replacement for binthis expression. b2/5b +5
Answers: 1
Mathematics, 21.06.2019 20:50, brea2006
An automobile assembly line operation has a scheduled mean completion time, μ, of 12 minutes. the standard deviation of completion times is 1.6 minutes. it is claimed that, under new management, the mean completion time has decreased. to test this claim, a random sample of 33 completion times under new management was taken. the sample had a mean of 11.2 minutes. assume that the population is normally distributed. can we support, at the 0.05 level of significance, the claim that the mean completion time has decreased under new management? assume that the standard deviation of completion times has not changed.
Answers: 3
Do you know the correct answer?
Quinn and Randy both opened savings accounts with $50. Quinn deposited $25 each week for 4 weeks. Ra...
Questions in other subjects:

Mathematics, 17.12.2020 08:50

Chemistry, 17.12.2020 08:50


Mathematics, 17.12.2020 08:50
Mathematics, 17.12.2020 08:50
Mathematics, 17.12.2020 08:50

History, 17.12.2020 08:50


