

Mathematics, 26.03.2021 20:30, officialrogerfp3gf2s
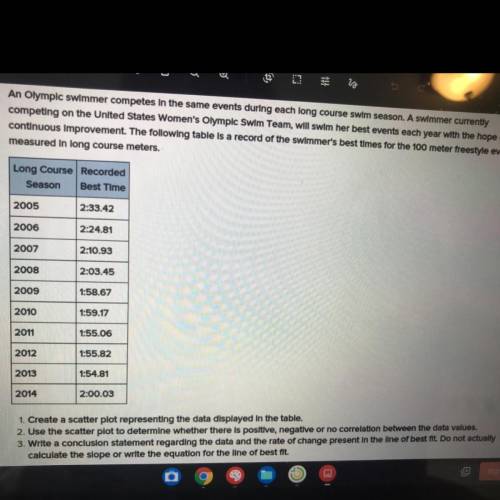
An Olympic swimmer competes in the same events during each long course swim season. A swimmer currently
competing on the United States Women's Olympic Swim Team, will swim her best events each year with the hope of continuous Improvement. The following table is a record of the swimmer's best times for the 100 meter freestyle event,
measured In long course meters.
Long Course Recorded
Season Best Time
2005 2:33.42
2006
2:24.81
2007
2:10.93
2008
2:03.45
2009
1:58.67
2010
1:59.17
1:55.06
2011
2012
1:55.82
2013
1:54.81
2014
2:00.03
1. Create a scatter plot representing the data displayed in the table.
2. Use the scatter plot to determine whether there is positive, negative or no correlation between the data values.
3. Write a conclusion statement regarding the data and the rate of change present in the line of best fit. Do not actually
calculate the slope or write the equation for the line of best fit.
Please help me
Will give
Just give me the answer to 2 and 3
I already have 1
I just need 2 and 3
Please and thank you
Please help me please

Answers: 3


Other questions on the subject: Mathematics
Mathematics, 21.06.2019 20:00, villarrealc1987
The function models the number of accidents per 50 million miles driven as a function
Answers: 1
Mathematics, 21.06.2019 22:30, cordobamariana07
The difference of three and the reciprocal of a number is equal to the quotient of 20 and the number. find the number.
Answers: 2
Mathematics, 22.06.2019 01:00, lilblackbird4
X^2/100+y^2/25=1 the y-intercepts are at: a) (-10,0) and (10,0) b) (0,10) and (0,5) c) (0,-5) and (0,5)
Answers: 1
Do you know the correct answer?
An Olympic swimmer competes in the same events during each long course swim season. A swimmer curren...
Questions in other subjects:


History, 11.03.2020 00:38


