

Mathematics, 26.03.2021 20:00, layla07
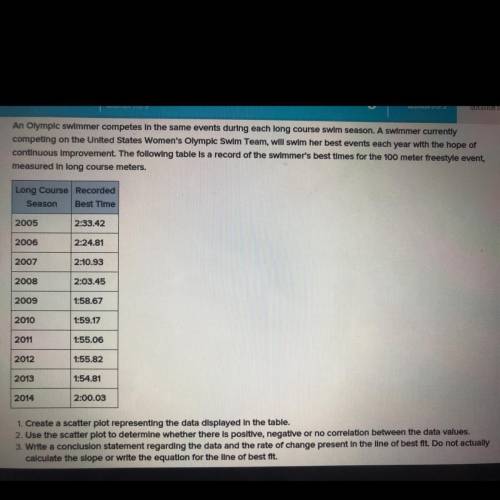
An Olympic swimmer competes in the same events during each long course swim season. A swimmer currently
competing on the United States Women's Olympic Swim Team, will swim her best events each year with the hope of
continuous Improvement. The following table is a record of the swimmer's best times for the 100 meter freestyle event,
measured In long course meters.
Long Course Recorded
Season Best Time
2005 2:33.42
2006
2:24.81
2007
2:10.93
2008
2:03.45
2009
1:58.67
2010
1:59.17
1:55.06
2011
2012
1:55.82
2013
1:54.81
2014
2:00.03
1. Create a scatter plot representing the data displayed in the table.
2. Use the scatter plot to determine whether there is positive, negative or no correlation between the data values.
3. Write a conclusion statement regarding the data and the rate of change present in the line of best fit. Do not actually
calculate the slope or write the equation for the line of best fit.
Please help me
Will give
Just give me the answer to 2 and 3
I already have 1
I just need 2 and 3
Please and thank you

Answers: 2


Other questions on the subject: Mathematics
Mathematics, 21.06.2019 19:30, gonzalesalexiaouv1bg
The wheels of a bicycle have a diameter of 70cm. how many meters will the bicycle travel if each wheel makes 50 revolutions
Answers: 2
Mathematics, 21.06.2019 20:30, qveenvslayin
Erin bought christmas cards for $2 each to send to her family and friends. which variable is the dependent variable?
Answers: 1
Do you know the correct answer?
An Olympic swimmer competes in the same events during each long course swim season. A swimmer curren...
Questions in other subjects:


Engineering, 26.02.2021 20:20
Mathematics, 26.02.2021 20:30
Mathematics, 26.02.2021 20:30
Mathematics, 26.02.2021 20:30
Mathematics, 26.02.2021 20:30

Mathematics, 26.02.2021 20:30


