


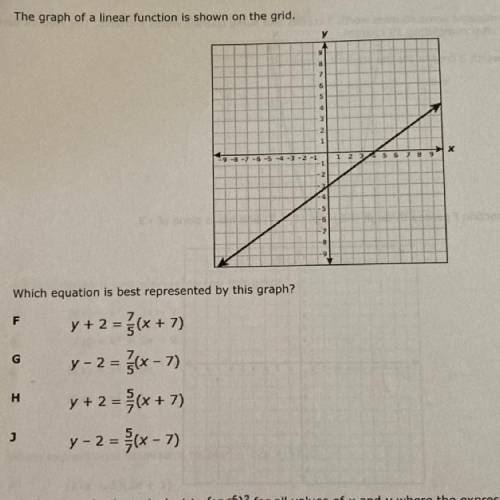
The graph of a linear function is shown on the grid.
y
X
--
-1
Which equati...

Mathematics, 26.03.2021 19:10, indiii
The graph of a linear function is shown on the grid.
y
X
--
-1
Which equation is best represented by this graph?

Answers: 1
Other questions on the subject: Mathematics
Mathematics, 21.06.2019 13:10, lwilliams28
Which of the following would represent the sum of 3 consecutive integers if x is the first integer?
Answers: 3
Mathematics, 21.06.2019 21:30, justkevin1231
The domain of a function can be represented by which one of the following options? o a. a set of output values o b. a set of f(x) values o c. a set of input values o d. a set of both input and output values
Answers: 3
Do you know the correct answer?
Questions in other subjects:

History, 01.07.2019 07:10

Business, 01.07.2019 07:10

Computers and Technology, 01.07.2019 07:10
History, 01.07.2019 07:10

Biology, 01.07.2019 07:10
History, 01.07.2019 07:10
Biology, 01.07.2019 07:10
Business, 01.07.2019 07:10

Geography, 01.07.2019 07:10


