


Due
Seatter Plots (making predictions)
Hor's Elevation
3.000
Hiking The scatter p...

Mathematics, 26.03.2021 18:50, Kigarya
Due
Seatter Plots (making predictions)
Hor's Elevation
3.000
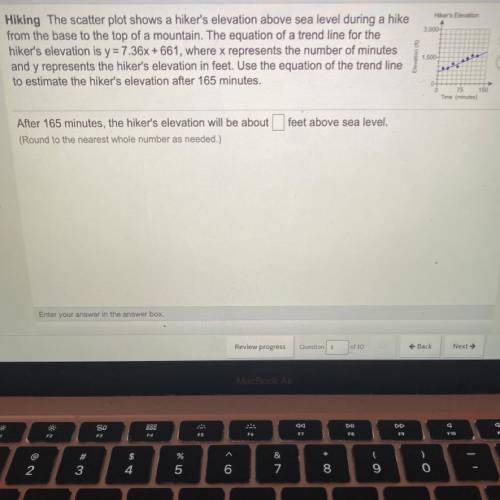
Hiking The scatter plot shows a hiker's elevation above sea level during a hike
from the base to the top of a mountain. The equation of a trend line for the
hiker's elevation is y=7.36x + 661, where x represents the number of minutes
and y represents the hiker's elevation in feet. Use the equation of the trend line
to estimate the hiker's elevation after 165 minutes.
1.500
10
Time
After 165 minutes, the hiker's elevation will be about feet above sea level.
(Round to the nearest whole number as needed.)

Answers: 1
Other questions on the subject: Mathematics
Mathematics, 21.06.2019 17:30, tnassan5715
What is the shape of the height and weight distribution
Answers: 2
Mathematics, 21.06.2019 19:30, auviannadority13
Equation for the calculation double 2 and then add 5
Answers: 1
Do you know the correct answer?
Questions in other subjects:


Computers and Technology, 05.04.2021 19:30

Social Studies, 05.04.2021 19:30

Engineering, 05.04.2021 19:30

English, 05.04.2021 19:30

Biology, 05.04.2021 19:30
English, 05.04.2021 19:30
Mathematics, 05.04.2021 19:30


