

Mathematics, 26.03.2021 01:00, kassandramarie16
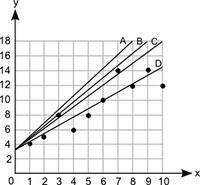
Which line best represents the line of best fit for this scatter plot? Graph shows numbers from 0 to 10 at increments of 1 on the x axis and numbers from 0 to 18 at increments of 2. Scatter plot shows ordered pairs 1, 4 and 2, 5 and 3, 8 and 4, 6 and 5, 8 and 6, 10 and 7, 14 and 8, 12 and 9, 14 and 10, 12. A line labeled A joins ordered pair 0, 3.2 and 8, 18. A line labeled B joins ordered pairs 0, 3.2 and 9, 18. A line labeled C joins ordered pairs 0, 3.2 and 10, 18. A line labeled D joins ordered pairs 0, 3.2 and 10, 14.2. Line A Line B Line C Line D

Answers: 3


Other questions on the subject: Mathematics
Mathematics, 20.06.2019 18:04, marshalldayton1452
Which expression shows the result of applying the distributive property to 9(2+5m) 11 + 14m 18 + 45m 18 + 5m 2 + 45m
Answers: 1
Mathematics, 21.06.2019 17:30, meganenaranjo
If the speed of an electromagnetic wave is 100,000 cm/s and its wavelength is 100 cm, what is its frequency? a) 100,000 cycles per second (hz) b) 1 × 10⁻³ cycles per second (hz) c) 10,000,000 cycles per second (hz) d) 1,000 cycles per second (hz)
Answers: 1
Do you know the correct answer?
Which line best represents the line of best fit for this scatter plot? Graph shows numbers from 0 to...
Questions in other subjects:


Mathematics, 06.05.2020 19:59
Mathematics, 06.05.2020 19:59

Physics, 06.05.2020 19:59


