

Mathematics, 25.03.2021 20:40, Reagan650
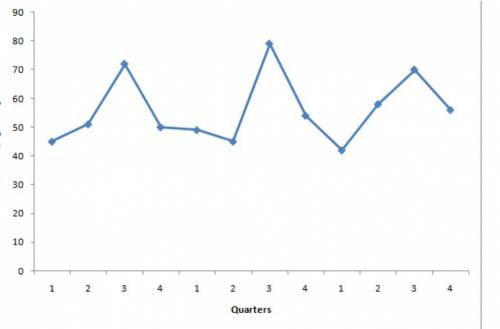
The following data shows the quarterly profit (in thousands of dollars) made by a particular company in the past 3 years.
Year Quarter Profit ($1000s)
1 1 45
1 2 51
1 3 72
1 4 50
2 1 49
2 2 45
2 3 79
2 4 54
3 1 42
3 2 58
3 3 70
3 4 56
Required:
a. Construct a time series plot. What type of pattern exists in the data?
b. Develop a three-period moving average for this time series. Compute MSE and a forecast of profit (in $1000s) for the next quarter.

Answers: 1


Other questions on the subject: Mathematics
Mathematics, 21.06.2019 14:00, robertsabbiegale
Brook states that the distance on the line is 4 units. caleb states that the whole line does not have a distance because it continues on forever. vivian states that the line is 6 units long. which distance did brook measure? which distance did vivian measure?
Answers: 1
Mathematics, 21.06.2019 18:30, dallasherncastrillo
Which of the following is the true for f(x) = 5cos
Answers: 2
Mathematics, 21.06.2019 19:00, AbhiramAkella
You earn a 12% commission for every car you sell. how much is your commission if you sell a $23,000 car?
Answers: 1
Do you know the correct answer?
The following data shows the quarterly profit (in thousands of dollars) made by a particular company...
Questions in other subjects:

Mathematics, 01.11.2020 04:50


Mathematics, 01.11.2020 04:50

Spanish, 01.11.2020 04:50
Mathematics, 01.11.2020 04:50
Arts, 01.11.2020 04:50


