

Mathematics, 25.03.2021 07:10, jdkrisdaimcc11
SOMEONE PLEASE HELP...
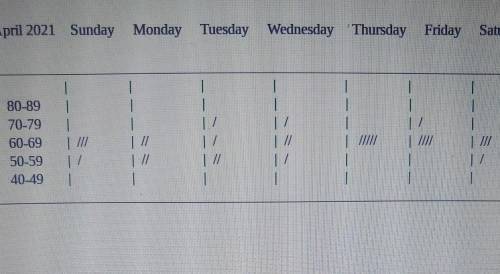
I. Construct a chart like the sample in the discussion. Try to have no fewer than five class intervals. "Class interval" refers to the number of categories a type of data could fall into (e. g., 70-79 degrees, 80-89 degrees, etc.).
II. Compute the probability that an observation picked at random will be a Saturday observation.
III. Repeat number two for the remaining days of the week.
IV. Use the chart in the discussion to answer these questions: a. What is the probability a day in the 70s is a Monday? b. Which set forms the intersection of Tuesdays in the 80s? c. What is the probability an observation picked at random is both a Sunday and more than 90 degrees?
V. Construct a histogram to display the temperature frequencies for the month. (Use temperature class intervals and totals.)
VI. Pretend that you are working for the tourist bureau for your city. Which measure of central tendency (mean, median, mode) would you use in advertising to attract tourists. Justify your answer.

Answers: 2


Other questions on the subject: Mathematics
Mathematics, 21.06.2019 14:00, maddynichole2017
Solve |2x - 5| = 4 if anyone could , that would be great
Answers: 1
Mathematics, 22.06.2019 03:30, emilylunaa
Sections of prefabricated woods are each 5 1/3 feet long, how long are 7 1/2 sections placed end to end?
Answers: 3
Mathematics, 22.06.2019 05:00, s0cial0bessi0n
What is the distance between (5 - 2i) and (8 + i)?
Answers: 2
Do you know the correct answer?
SOMEONE PLEASE HELP...
I. Construct a chart like the sample in the discussion. Try to have no fewer...
Questions in other subjects:

Mathematics, 03.01.2022 18:10
Mathematics, 03.01.2022 18:10


