

Mathematics, 24.03.2021 16:40, carryislarrywithdair
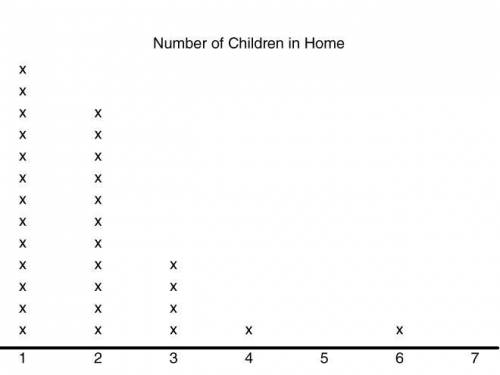
The following dot plot represents a random sample of elementary students and the number of children that live in their home.
If this random sample is representative of elementary students in the United States, which of the following inferences can be made from the data? Select all that apply.
1. The majority of the households in the United States, with at least one child, contain less than three children.
2. Very few households in the United States contain four or more children.
3. None of the households in the United States contain five children.
4. All household in the United States contain at least one child.

Answers: 1


Other questions on the subject: Mathematics
Mathematics, 21.06.2019 14:30, lizzie3545
Which quadratic function best fits this data? x y 1 32 2 78 3 178 4 326 5 390 6 337 a. y=11.41x2+154.42x−143.9 b. y=−11.41x2+154.42x−143.9 c. y=11.41x2+154.42x+143.9 d. y=−11.41x2+154.42x+143.9
Answers: 3
Mathematics, 21.06.2019 19:30, indiaseel2744
Suppose i pick a jelly bean at random from a box containing one red and eleven blue ones. i record the color and put the jelly bean back in the box. if i do this three times, what is the probability of getting a blue jelly bean each time? (round your answer to three decimal places.)
Answers: 1
Mathematics, 21.06.2019 21:20, pampam49
An office supply company conducted a survey before marketing a new paper shredder designed for home use. in the survey, 80 % of the people who tried the shredder were satisfied with it. because of this high satisfaction rate, the company decided to market the new shredder. assume that 80 % of all people are satisfied with this shredder. during a certain month, 100 customers bought this shredder. find the probability that of these 100 customers, the number who are satisfied is 69 or fewer.
Answers: 2
Mathematics, 22.06.2019 00:00, thornlilly17
Asequence has a common ratio of and f(5) = 81. which explicit formula represents the sequence? f(x) = 24 f(x) = 16 f(x) = 24 f(x) = 16
Answers: 1
Do you know the correct answer?
The following dot plot represents a random sample of elementary students and the number of children...
Questions in other subjects:

Business, 30.08.2021 01:00
Mathematics, 30.08.2021 01:00

Social Studies, 30.08.2021 01:00

Chemistry, 30.08.2021 01:00

English, 30.08.2021 01:00
Chemistry, 30.08.2021 01:00

Mathematics, 30.08.2021 01:00


