Mathematics
Mathematics, 24.03.2021 14:00, queentynaisa

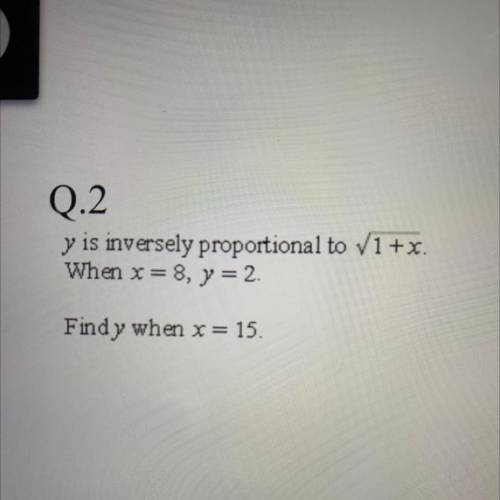
0.2 y is inversely proportional to V1+x.
When x=8, y = 2.
Find y when x = 15.

Please help me with this real quick!


0.2

y is inversely proportional to V1+x.
When x=8, y = 2.
Find y when x = 15.
Please help me with

answer
Answers: 1

Other questions on the subject: Mathematics

image
Mathematics, 21.06.2019 17:00, Taylor129
Imogene invested $8,000 in a bank account that pays 8 percent simple interest at the end of each year. her friend invested the same amount in stocks where the growth of the investment is represented as 2,000 times the square root of 2 less than the time lapsed in years. if y1 and y2 represent the amount earned in dollars and t is the time lapsed in years, which system of equations correctly represents the situation?
Answers: 1
image
Mathematics, 21.06.2019 19:30, bxbykyah
You have learned about the six trigonometric functions, their definitions, how to use them, and how to represent them graphically. the sine, cosine, and tangent trigonometric functions can be paired with their reciprocal functions, cosecant, secant, and cotangent, respectively. think about how each function is related to its reciprocal function. how are the graphs of the reciprocal functions related to their corresponding original functions? what happens to the graphs of the reciprocal functions as x approaches the zeros of the original functions? describe how you would teach friends with different learning styles (visual-spatial, aural-auditory, verbal-linguistic, physical-bodily-kinesthetic, logical-mathematical, social-interpersonal, and solitary-intrapersonal) how to graph the reciprocal functions
Answers: 2
image
Mathematics, 21.06.2019 19:30, ally6977
The measure of an angle is 117°. what is the measure of a supplementary angle?
Answers: 2
image
Mathematics, 22.06.2019 01:30, jude40
Asample of 200 rom computer chips was selected on each of 30 consecutive days, and the number of nonconforming chips on each day was as follows: the data has been given so that it can be copied into r as a vector. non. conforming = c(10, 15, 21, 19, 34, 16, 5, 24, 8, 21, 32, 14, 14, 19, 18, 20, 12, 23, 10, 19, 20, 18, 13, 26, 33, 14, 12, 21, 12, 27) #construct a p chart by using the following code. you will need to enter your values for pbar, lcl and ucl. pbar = lcl = ucl = plot(non. conforming/200, ylim = c(0,.5)) abline(h = pbar, lty = 2) abline(h = lcl, lty = 3) abline(h = ucl, lty = 3)
Answers: 3