

Mathematics, 24.03.2021 09:40, tylorroundy
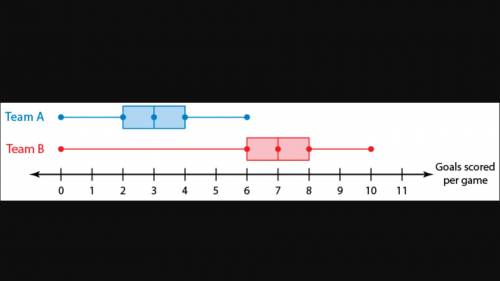
The double box-and-whisker plot shows the goals scored per game by two hockey teams during a 20-game season.
a. Compare the populations using measures of center and variation.
Team A: median = 3, IQR = 2
Team B: median = 7, IQR = 2
The variation in the goals scored is the same, but Team B usually scores about 4 more goals per game.
Team A: median = 3, IQR = 2
Team B: median = 7, IQR = 2
The variation in the goals scored differs by 4, but the number of goals scored per game is the same.
Team A: median = 6, IQR = 2
Team B: median = 10, IQR = 2
The variation in the goals scored is the same, but Team B usually scores about 4 more goals per game.
Team A: median = 6, IQR = 2
Team B: median = 10, IQR = 2
The variation in the goals scored differs by 4, but the number of goals scored per game is the same.
b. Express the difference in the measures of center as a multiple of the measure of variation.
The difference in the medians is (blank) times the IQR.

Answers: 1


Other questions on the subject: Mathematics
Mathematics, 21.06.2019 22:00, kiararoman1715
Aschool allots ? 1500 to spend on a trip to the theatre. theatre tickets have a regular cost of ? 55 each and are on offer for 1 5 off. a train ticket for the day will cost ? 12 each. if 2 teachers and the maximum number of students attend, how much money will the school have left over?
Answers: 2
Mathematics, 21.06.2019 23:30, stevenssimeon30
Jane has 5 nickels. john has 3 dimes. jane says she has a greater amount of money. with the information given, is she correct?
Answers: 3
Do you know the correct answer?
The double box-and-whisker plot shows the goals scored per game by two hockey teams during a 20-game...
Questions in other subjects:

Social Studies, 20.08.2021 14:40
Mathematics, 20.08.2021 14:40


Biology, 20.08.2021 14:40


English, 20.08.2021 14:50
Chemistry, 20.08.2021 14:50
Mathematics, 20.08.2021 14:50


