


A car moves from rest.
The graph gives information about the speed, v metres per second,
of t...

Mathematics, 23.03.2021 23:50, chase1869
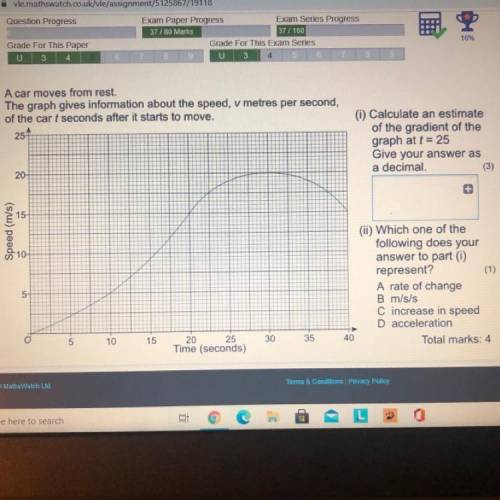
A car moves from rest.
The graph gives information about the speed, v metres per second,
of the car t seconds after it starts to move.
251
(i) Calculate an estimate
of the gradient of the
graph at t = 25
Give your answer as
a decimal.
(3)
20-
15
Speed (m/s)
10
(ii) Which one of the
following does your
answer to part (1)
represent?
(1)
A rate of change
B m/s/s
C increase in speed
D acceleration
40
Total marks:
5
o
5
10
15
30
35
20 25
Time (seconds)

Answers: 1
Other questions on the subject: Mathematics
Mathematics, 21.06.2019 20:30, shelbylynn17
The function show two sisters' savings account and the rate at which they plan to deposit money
Answers: 3
Mathematics, 22.06.2019 02:00, mathhelppls14
1. the manager of collins import autos believes the number of cars sold in a day (q) depends on two factors: (1) the number of hours the dealership is open (h) and (2) the number of salespersons working that day (s). after collecting data for two months (53 days), the manager estimates the following log-linear model: q 4 equation 1 a. explain, how to transform the log-linear model into linear form that can be estimated using multiple regression analysis. the computer output for the multiple regression analysis is shown below: q4 table b. how do you interpret coefficients b and c? if the dealership increases the number of salespersons by 20%, what will be the percentage increase in daily sales? c. test the overall model for statistical significance at the 5% significance level. d. what percent of the total variation in daily auto sales is explained by this equation? what could you suggest to increase this percentage? e. test the intercept for statistical significance at the 5% level of significance. if h and s both equal 0, are sales expected to be 0? explain why or why not? f. test the estimated coefficient b for statistical significance. if the dealership decreases its hours of operation by 10%, what is the expected impact on daily sales?
Answers: 2
Do you know the correct answer?
Questions in other subjects:
Mathematics, 07.12.2020 19:50
Mathematics, 07.12.2020 19:50
Mathematics, 07.12.2020 19:50

Mathematics, 07.12.2020 19:50

Biology, 07.12.2020 19:50

History, 07.12.2020 19:50
Mathematics, 07.12.2020 19:50


