

Mathematics, 23.03.2021 23:10, chloegirl7994
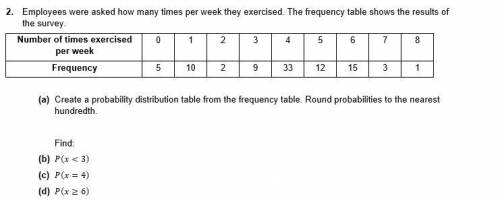
Employees were asked how many times per week they exercised. The frequency table shows the results of the survey.
Number of times exercised per week 0 1 2 3 4 5 6 7 8
Frequency 5 10 2 9 33 12 15 3 1
Create a probability distribution table from the frequency table. Round probabilities to the nearest hundredth.
Find:
P(x<3)
P(x=4)
P(x≥6)

Answers: 1


Other questions on the subject: Mathematics
Mathematics, 21.06.2019 14:40, olivialaine31
Which graph represents the following piecewise defined function?
Answers: 2
Do you know the correct answer?
Employees were asked how many times per week they exercised. The frequency table shows the results o...
Questions in other subjects:

Biology, 31.08.2019 13:30
Biology, 31.08.2019 13:30


Social Studies, 31.08.2019 13:30

Mathematics, 31.08.2019 13:30

History, 31.08.2019 13:30
Business, 31.08.2019 13:30


