


Tools
Question 11
The table shows the relationship between y, the cost to rent a boat, and th...

Mathematics, 23.03.2021 17:50, eggg65
Tools
Question 11
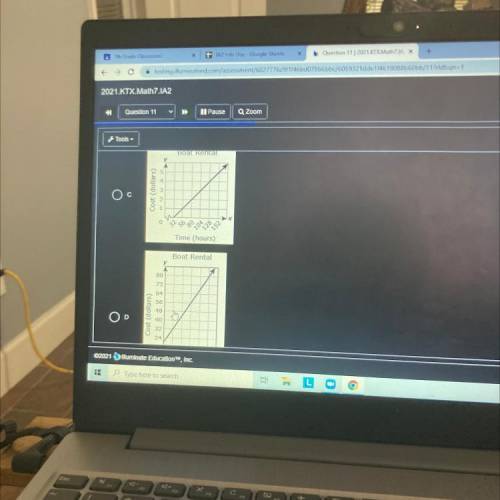
The table shows the relationship between y, the cost to rent a boat, and the amount of time the boat is rented,
Boat Rental Costs
Time, X Cost, v
(hours) (dollars)
1
3
5
80
7
104
Which graph best represents the relationship between x and y shown in the table

Answers: 2
Other questions on the subject: Mathematics
Mathematics, 21.06.2019 21:30, mandyangle01
Using pert, adam munson was able to determine that the expected project completion time for the construction of a pleasure yacht is 21 months, and the project variance is 4. a) what is the probability that the project will be completed in 17 months? b) what is the probability that the project will be completed in 20 months? c) what is the probability that the project will be completed in 23 months? d) what is the probability that the project will be completed in 25 months? e) what is the due date that yields a 95% chance of completion?
Answers: 3
Mathematics, 21.06.2019 22:30, edgartorres5123
What is 100,000 times 1/100,000, using the standard method of multiplication? write the answer as 10 to a power.
Answers: 1
Mathematics, 21.06.2019 23:00, spaigenicole
Someone answer this asap for the first five terms of a sequence are shown. 5, 11, 23, 47, 95, . . which recursive function defines the nth term in the sequence for n > 1? a. f(n) = f(n - 1) + 6 b) f(n) = f(n - 1) + 48 c) f(n) = 3 • f(n - 1) + 1 d) f(n) = 3 • f(n - 1) - 4
Answers: 1
Do you know the correct answer?
Questions in other subjects:

History, 09.04.2021 19:50

Arts, 09.04.2021 19:50

Arts, 09.04.2021 19:50

Spanish, 09.04.2021 19:50


