

Mathematics, 23.03.2021 16:30, staceyh146
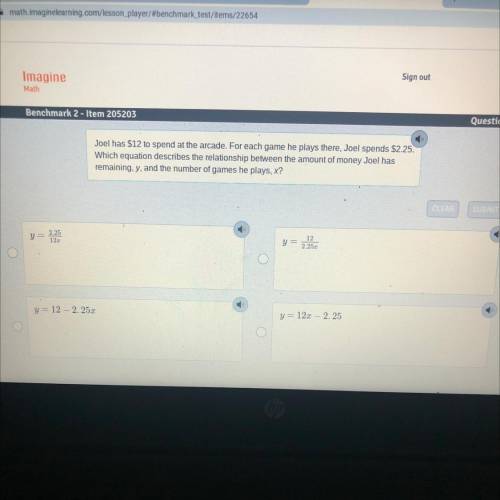
Joel has $12 to spend at the arcade. For each game he plays there, Joel spends $2.25. Which equation describes the relationship between the amount of money Joel has remaining, y, and the number of games he plays, x?

Answers: 2


Other questions on the subject: Mathematics
Mathematics, 21.06.2019 20:40, alemvp8219
Reduce fractions expressing probability to lowest terms. in 3,000 repetitions of an experiment, a random event occurred in 500 cases. the expected probability of this event is?
Answers: 3
Mathematics, 21.06.2019 22:00, ashhleyjohnson
After a dreary day of rain, the sun peeks through the clouds and a rainbow forms. you notice the rainbow is the shape of a parabola. the equation for this parabola is y = -x2 + 36. graph of a parabola opening down at the vertex 0 comma 36 crossing the x–axis at negative 6 comma 0 and 6 comma 0. in the distance, an airplane is taking off. as it ascends during take-off, it makes a slanted line that cuts through the rainbow at two points. create a table of at least four values for the function that includes two points of intersection between the airplane and the rainbow. analyze the two functions. answer the following reflection questions in complete sentences. what is the domain and range of the rainbow? explain what the domain and range represent. do all of the values make sense in this situation? why or why not? what are the x- and y-intercepts of the rainbow? explain what each intercept represents. is the linear function you created with your table positive or negative? explain. what are the solutions or solution to the system of equations created? explain what it or they represent. create your own piecewise function with at least two functions. explain, using complete sentences, the steps for graphing the function. graph the function by hand or using a graphing software of your choice (remember to submit the graph).
Answers: 2
Mathematics, 22.06.2019 00:00, girlieredc
Apolygon is shown on the graph: a polygon is shown on the coordinate plane. vertices are located at 3 comma 5, 1 comma 3, 1 comma 1, 2 comma 0, 4 comma 0, 5 comma 1, and 5 comma 3. what effect will a translation 3 units down and 2 units left have on the polygon? be sure to address how it could impact the angles, side lengths, and congruency between the original pre-image and the image. xd i need
Answers: 3
Mathematics, 22.06.2019 01:30, jude40
Asample of 200 rom computer chips was selected on each of 30 consecutive days, and the number of nonconforming chips on each day was as follows: the data has been given so that it can be copied into r as a vector. non. conforming = c(10, 15, 21, 19, 34, 16, 5, 24, 8, 21, 32, 14, 14, 19, 18, 20, 12, 23, 10, 19, 20, 18, 13, 26, 33, 14, 12, 21, 12, 27) #construct a p chart by using the following code. you will need to enter your values for pbar, lcl and ucl. pbar = lcl = ucl = plot(non. conforming/200, ylim = c(0,.5)) abline(h = pbar, lty = 2) abline(h = lcl, lty = 3) abline(h = ucl, lty = 3)
Answers: 3
Do you know the correct answer?
Joel has $12 to spend at the arcade. For each game he plays there, Joel spends $2.25.
Which equatio...
Questions in other subjects:

Mathematics, 15.06.2020 00:57


