

Mathematics, 22.03.2021 22:40, Reagan650
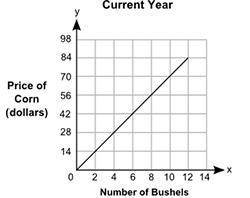
The graph shows the prices of different numbers of bushels of corn at a store in the current year. The table shows the prices of different numbers of bushels of corn at the same store in the previous year.
Table:
Previous Year
Number of Bushels
Price of Corn (dollars)
2
10
4
20
6
30
8
40
Part A: Describe in words how you can find the rate of change of a bushel of corn in the current year, and find the value. (5 points)
Part B: How many dollars more is the price of a bushel of corn in the current year than the price of a bushel of corn in the previous year? Show your work. (5 points)

Answers: 1


Other questions on the subject: Mathematics
Mathematics, 20.06.2019 18:04, cupcake3103670
Mrs. renoir has completed the interior portion of a quilt top measuring
Answers: 1
Mathematics, 21.06.2019 16:30, BreadOfTheBear
Hi my sisters and brothers can tell me the answer because i don’t understand the question
Answers: 1
Mathematics, 21.06.2019 17:30, kingfptduong
How many bananas are in a fruit bowl that has 200 total apples and bananas if there are 31 bananas for every 93 apples
Answers: 1
Do you know the correct answer?
The graph shows the prices of different numbers of bushels of corn at a store in the current year. T...
Questions in other subjects:
Mathematics, 29.10.2020 03:10


History, 29.10.2020 03:10
Mathematics, 29.10.2020 03:10
Mathematics, 29.10.2020 03:10
Mathematics, 29.10.2020 03:10
Mathematics, 29.10.2020 03:10
Mathematics, 29.10.2020 03:10
History, 29.10.2020 03:10


