

Mathematics, 22.03.2021 07:40, aliami0306oyaj0n
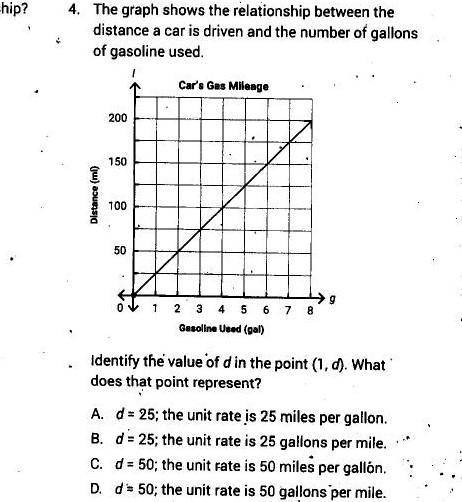
The graph shows the relationship between the distance a car is driven and the number of gallons of gasoline used. Identify the value in d in the point (1, d). What does that point represent?
A. d=25; the unit rate is 25 miles per gallon
B. d=25; the unit rate is 25 gallons per mile
C. d=50; the unit rate is 50 miles per gallon
D. d=50; the unit rate is 50 gallons per mile

Answers: 1


Other questions on the subject: Mathematics
Mathematics, 21.06.2019 14:00, kyusra2008
The graph of a line gets what as the value of the slope gets bigger
Answers: 2
Mathematics, 21.06.2019 16:20, jennyferluna0216
Refer to interactive solution 17.45 to review a method by which this problem can be solved. the fundamental frequencies of two air columns are the same. column a is open at both ends, while column b is open at only one end. the length of column a is 0.504 m. what is the length of column b?
Answers: 1
Do you know the correct answer?
The graph shows the relationship between the distance a car is driven and the number of gallons of g...
Questions in other subjects:

Mathematics, 21.08.2019 10:10

Mathematics, 21.08.2019 10:10

World Languages, 21.08.2019 10:10


