

Mathematics, 19.03.2021 22:40, rissa8227
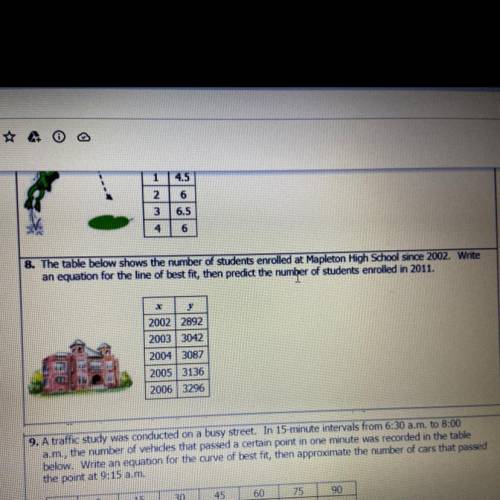
& The table below shows the number of students enrolled at Mapleton High School Since 2002. Write
an equation for the line of best fit, then predict the number of students enrolled in 2011.
2002 2892
2003 3042
20043087
2005 3136
2006 3296

Answers: 2


Other questions on the subject: Mathematics
Mathematics, 21.06.2019 19:20, joelpimentel
Which number line represents the solution set for the inequality - x 24?
Answers: 3
Mathematics, 21.06.2019 20:10, sksksksksk1
Heather is writing a quadratic function that represents a parabola that touches but does not cross the x-axis at x = -6. which function could heather be writing? fx) = x2 + 36x + 12 = x2 - 36x - 12 f(x) = -x + 12x + 36 f(x) = -x? - 12x - 36
Answers: 1
Do you know the correct answer?
& The table below shows the number of students enrolled at Mapleton High School Since 2002. Writ...
Questions in other subjects:
Mathematics, 12.10.2019 06:50


Biology, 12.10.2019 06:50
Mathematics, 12.10.2019 06:50

English, 12.10.2019 06:50


