

Mathematics, 19.03.2021 21:10, Lizzy527663
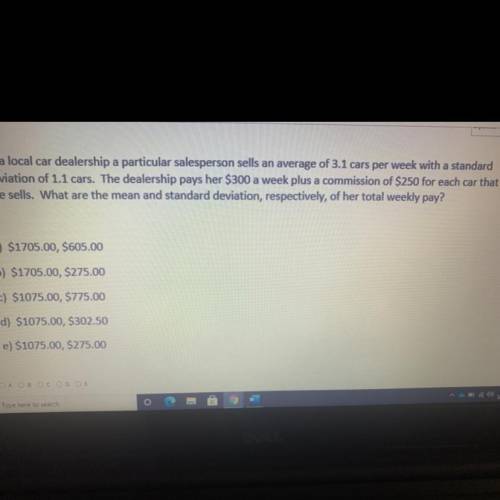
At a local car dealership a particular salesperson sells an average of 3.1 cars per week with a standard
deviation of 1.1 cars. The dealership pays her $300 a week plus a commission of $250 for each car that
she sells. What are the mean and standard deviation, respectively, of her total weekly pay? PLs help

Answers: 3


Other questions on the subject: Mathematics
Mathematics, 21.06.2019 14:00, sbelgirl2000
Question 3 of 30 paul buys fruit to make smoothies. he buys 3.78 pounds of apples, 2.12 pounds of peaches, and 4.45 pounds of oranges. paul rounds each weight to the nearest tenth of a pound. about how many pounds of fruit did paul buy? (a) 10.5 pounds (b) 10.2 pounds (c) 10.4 pounds (d) 10.0 pounds 30 points
Answers: 2
Mathematics, 21.06.2019 14:30, garrettrhoad
The amount of money, in dollars, in an account after t years is given by a = 1000(1.03)^t. the initial deposit into the account was $_^a0 and the interest rate was _a1% per year. only enter numbers in the boxes. do not include any commas or decimal points^t. the initial deposit into the account was $__^a0 and the interest rate is % per year.
Answers: 2
Mathematics, 21.06.2019 16:00, kell22wolf
Part one: measurements 1. measure your own height and arm span (from finger-tip to finger-tip) in inches. you will likely need some from a parent, guardian, or sibling to get accurate measurements. record your measurements on the "data record" document. use the "data record" to you complete part two of this project. name relationship to student x height in inches y arm span in inches archie dad 72 72 ginelle mom 65 66 sarah sister 64 65 meleah sister 66 3/4 67 rachel sister 53 1/2 53 emily auntie 66 1/2 66 hannah myself 66 1/2 69 part two: representation of data with plots 1. using graphing software of your choice, create a scatter plot of your data. predict the line of best fit, and sketch it on your graph. part three: the line of best fit include your scatter plot and the answers to the following questions in your word processing document 1. 1. which variable did you plot on the x-axis, and which variable did you plot on the y-axis? explain why you assigned the variables in that way. 2. write the equation of the line of best fit using the slope-intercept formula $y = mx + b$. show all your work, including the points used to determine the slope and how the equation was determined. 3. what does the slope of the line represent within the context of your graph? what does the y-intercept represent? 5. use the line of best fit to you to describe the data correlation.
Answers: 2
Do you know the correct answer?
At a local car dealership a particular salesperson sells an average of 3.1 cars per week with a stan...
Questions in other subjects:


Arts, 19.12.2020 18:50
Mathematics, 19.12.2020 18:50

Physics, 19.12.2020 18:50
Mathematics, 19.12.2020 19:00
Mathematics, 19.12.2020 19:00
English, 19.12.2020 19:00
Physics, 19.12.2020 19:00

Health, 19.12.2020 19:00


