

Mathematics, 19.03.2021 20:40, Derrielle6451
Unit 6 Statistics Test SY 2020-2021 / 14 of 17
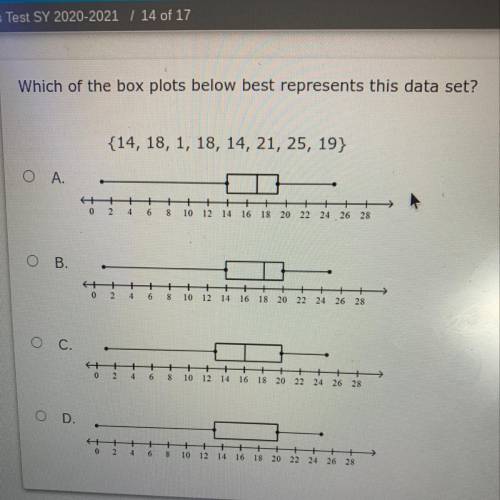
Which of the box plots below best represents this data set?
{14, 18, 1, 18, 14, 21, 25, 19}
Ο Α.
>
O
10 12 14 16 18 20 22 24 26 28
О В
.
8 10 12 14 16 18
20 22 24 26 28
OC.
영
!
10 12 14 16 18 20 22 24 26 28
C D
10 12 14 16 18 20 22 24 26 28

Answers: 3


Other questions on the subject: Mathematics
Mathematics, 21.06.2019 15:30, cbaillie8462
20 only answer if 100% sure most high school-aged teens are very active. a. true b. false
Answers: 2
Mathematics, 21.06.2019 17:20, tinyiaihfurlow
Match the equivalent expressions. x - 3y + 12 12 - 3y - 2x + x + 2x 3x + 2y - 2x + y + 12 3y + 12 3x + y - 12 4y + 3y + 3x - 6y - 10 - 2 x + 3y + 2x - 3x + 7 + 5 x + 3y + 12 5 + 2y + 7x - 4x + 3y - 17
Answers: 1
Mathematics, 21.06.2019 17:30, kirsten8605
If the measure of angle 1 is 110 degrees and the measure of angle 3 is (2 x+10 degree), what is the value of x?
Answers: 2
Mathematics, 21.06.2019 23:00, edisonsitesuper9312
Joey is asked to name a quadrilateral that is also a rhombus and has 2 pairs of parallel sides. should be his answer
Answers: 1
Do you know the correct answer?
Unit 6 Statistics Test SY 2020-2021 / 14 of 17
Which of the box plots below best represents this da...
Questions in other subjects:

Advanced Placement (AP), 16.09.2019 17:30


Mathematics, 16.09.2019 17:30

Biology, 16.09.2019 17:40
History, 16.09.2019 17:40


