

Mathematics, 19.03.2021 19:20, hinacat87
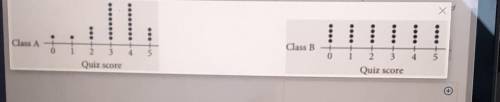
The dot plots below show the distributions of scores on a current events quiz for two classes of 24 students. Write a description of the standard deviation of the scores in each of the classes. Based on the spread of the data, which class performed better on the quiz.

Answers: 3


Other questions on the subject: Mathematics
Mathematics, 21.06.2019 15:00, estefanlionel8678
Which is the correct excel formula for the 80th percentile of a distribution that is n(475, 33)? =norm. dist(80,475,33,1) =norm. inv(0.80,475,33) =norm. s.inv((80-475)/33)?
Answers: 1
Do you know the correct answer?
The dot plots below show the distributions of scores on a current events quiz for two classes of 24...
Questions in other subjects:

Mathematics, 18.03.2021 03:20

Mathematics, 18.03.2021 03:20
Mathematics, 18.03.2021 03:20

Engineering, 18.03.2021 03:20


