


The graph displays the recorded speeds of a truck over certain time intervals.
60
50
40...

Mathematics, 19.03.2021 01:00, bhadd2001
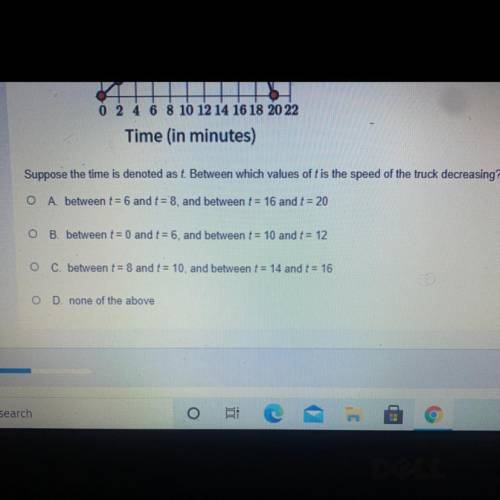
The graph displays the recorded speeds of a truck over certain time intervals.
60
50
40
30
Speed of Truck
(in miles per hour)
20
0 2 6 8 10 12 14 16 18 20 22
Time (in minutes)
Suppose the time is denoted ast Between which values oft is the speed of the truck decreasing?

Answers: 1
Other questions on the subject: Mathematics
Mathematics, 21.06.2019 23:50, dbag1162
The federal reserve controls certain interest rates in the united states. investors often try to speculate as to whether the federal reserve will raise or lower rates and by how much. suppose a company conducts extensive interviews with financial analysts, and as a result, predicts that "thefed" will increase rates by an average of 0.25 percentage points every six months for the forseeable future. which type of equation could be used to model the predicted interest rates over the next several years, assuming no other significant changes? a) a linear equation b) a quadratic equation c) a polynomial equation d) an exponential equation
Answers: 3
Mathematics, 22.06.2019 00:00, hdwoody2002
Percy rides his bike 11.2 miles in 1.4 hours at a constant rate. write an equation to represent the proportional relationship between the number of hours percy rides, x, and the distance in miles, y, that he travels.
Answers: 1
Do you know the correct answer?
Questions in other subjects:
Mathematics, 19.02.2021 14:20

Computers and Technology, 19.02.2021 14:20

Biology, 19.02.2021 14:20


Business, 19.02.2021 14:20

English, 19.02.2021 14:20

History, 19.02.2021 14:20


