

Mathematics, 18.03.2021 18:50, prissydizzybella5
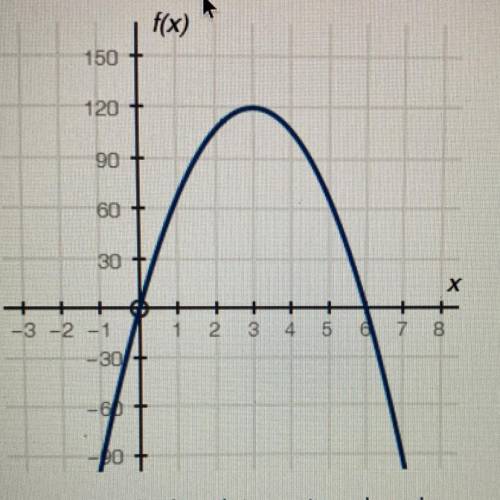
The graph below shows a company's profit f(x), in dollars, depending on the price of goods x. in dollars, being sold by the
company:
Part A: What do the x-intercepts and maximum value of the graph represent?
Part B: What are the intervals
where the function is increasing and decreasing, and what do they represent about the sale and
profit?
Part C: What is an approximate average rate of change of the graph from x = 1 to x = 3, and what does this rate represent?

Answers: 3


Other questions on the subject: Mathematics
Mathematics, 21.06.2019 18:00, bvaughn6477
Clara schumann is buying bagels for her coworkers, she buys a dozen bagels priced at $5.49 a dozen. the bakery's cost for making the bagels is $2.25 per dozen. what is the markup rate based on selling price on a dozen bagels?
Answers: 1
Do you know the correct answer?
The graph below shows a company's profit f(x), in dollars, depending on the price of goods x. in dol...
Questions in other subjects:

History, 15.01.2021 18:00
Mathematics, 15.01.2021 18:00
Mathematics, 15.01.2021 18:00

Biology, 15.01.2021 18:00

English, 15.01.2021 18:00
Mathematics, 15.01.2021 18:00


