


The average rainfall of a certain geographical location is modeled by the
table below.
Part A...

Mathematics, 18.03.2021 15:50, mauricestepenson791
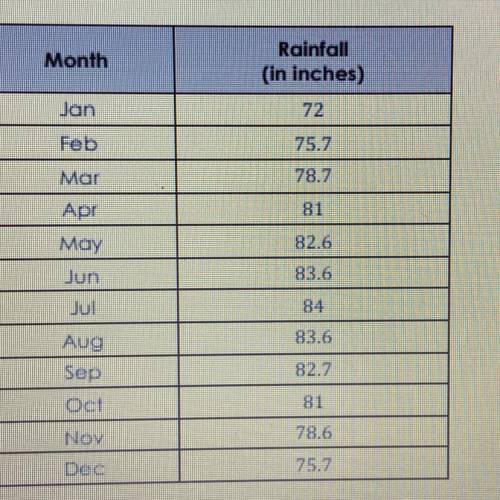
The average rainfall of a certain geographical location is modeled by the
table below.
Part A: Plot the data on the graph below if January is equivalent to x = 0.
Month
Rainfall
(in inches)
Jan
72
Feb
75.7
78.7
Mar
Apr
81
82.6
May
Jun
83.6
Jul
84
83.6
Aug
Sep
Oct
82.7
81
Nov
78.6
75.7
Dec
Part B: What type of geographical location might be represented by this
araph?

Answers: 2
Other questions on the subject: Mathematics
Mathematics, 21.06.2019 19:00, mbalderp5bxjo
Billy plotted −3 4 and −1 4 on a number line to determine that −3 4 is smaller than −1 4 is he correct? explain why or why not?
Answers: 3
Do you know the correct answer?
Questions in other subjects:


English, 22.02.2021 19:10

Mathematics, 22.02.2021 19:10


