Mathematics, 18.03.2021 14:00, bayloann3928
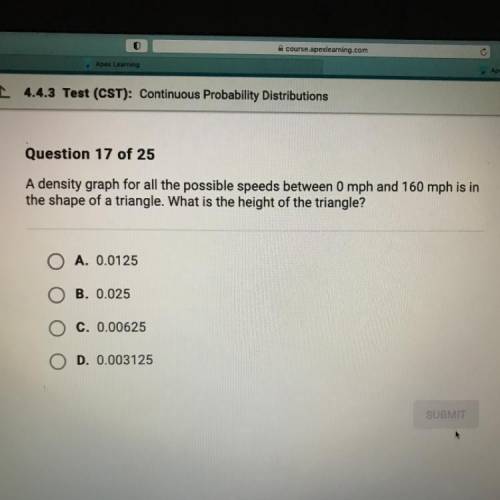
A density graph for all the possible speeds between 0 mph and 160 mph is in
the shape of a triangle. What is the height of the triangle?
A. 0.0125
B. 0.025
C. 0.00625
D. 0.003125


Answers: 3
Other questions on the subject: Mathematics

Mathematics, 21.06.2019 18:30, WendigoMeow
How do you create a data set with 8 points in it that has a mean of approximately 10 and a standard deviation of approximately 1?
Answers: 1

Mathematics, 21.06.2019 20:00, beverlyamya
Three baby penguins and their father were sitting on an iceberg 0.50.50, point, 5 meters above the surface of the water. the father dove down 4.74.74, point, 7 meters from the iceberg into the water to catch dinner for his kids. what is the father penguin's position relative to the surface of the water?
Answers: 2

Mathematics, 21.06.2019 21:30, girlysimbelieve
Aroulette wheel has 38 slots in which the ball can land. two of the slots are green, 18 are red, and 18 are black. the ball is equally likely to land in any slot. the roulette wheel is going to be spun twice, and the outcomes of the two spins are independent. the probability that it lands one time on red and another time on black in any order is(a) 0.5 (b) 0.25 (c) 0.4488 (d) 0.2244
Answers: 1

Mathematics, 21.06.2019 21:30, fheight01
Name and describe the three most important measures of central tendency. choose the correct answer below. a. the mean, sample size, and mode are the most important measures of central tendency. the mean of a data set is the sum of the observations divided by the middle value in its ordered list. the sample size of a data set is the number of observations. the mode of a data set is its highest value in its ordered list. b. the sample size, median, and mode are the most important measures of central tendency. the sample size of a data set is the difference between the highest value and lowest value in its ordered list. the median of a data set is its most frequently occurring value. the mode of a data set is sum of the observations divided by the number of observations. c. the mean, median, and mode are the most important measures of central tendency. the mean of a data set is the product of the observations divided by the number of observations. the median of a data set is the lowest value in its ordered list. the mode of a data set is its least frequently occurring value. d. the mean, median, and mode are the most important measures of central tendency. the mean of a data set is its arithmetic average. the median of a data set is the middle value in its ordered list. the mode of a data set is its most frequently occurring value.
Answers: 3
Do you know the correct answer?
A density graph for all the possible speeds between 0 mph and 160 mph is in
the shape of a triang...
Questions in other subjects:

Chemistry, 25.05.2021 01:30


Social Studies, 25.05.2021 01:30


Chemistry, 25.05.2021 01:30

Mathematics, 25.05.2021 01:30


