

Mathematics, 18.03.2021 14:00, danny1687
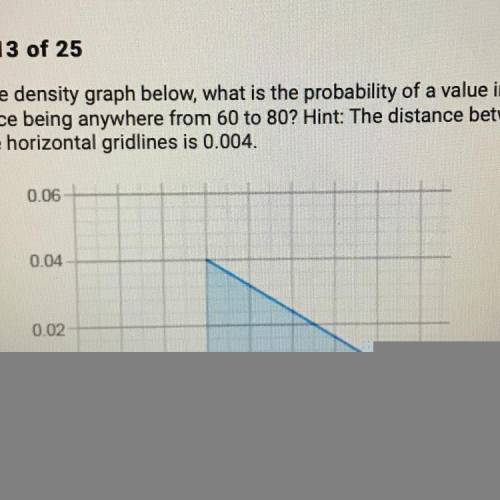
Based on the density graph below, what is the probability of a value in the
sample space being anywhere from 60 to 80? Hint: The distance between
consecutive horizontal gridlines is 0.004.
0.06
0.04
0.02
0.00
0
10
20
60
70
80
30 40 50
Sample space
A. 4%
B. 36%
C. 64%
D. 16%

Answers: 2


Other questions on the subject: Mathematics
Mathematics, 22.06.2019 01:30, colebash88
Paco orders an ice cream for $1, but realizes his wallet is at home and he only has 3/20 of $1 with him. if his mom pays the remaining 7/20 of the dollar, how much will she pay? $0.05 $0.15 $0.85 $0.95
Answers: 1
Mathematics, 22.06.2019 04:00, bre2354
An art teacher made a copy of a small painting. to make the painting easier to see the teacher enlarged the area of the painting by 49%. let y respresent the area of the original painting. the expression below is one way to resperesnt the area of the new painting. find two equivalent expressions that would give the area of the new painting y+0.49y
Answers: 1
Mathematics, 22.06.2019 06:00, imeldachavez124
Pierre is covered by his employers group major medical plan. his employer pays for 75% of the premium and he pays for 25%. how much would a $10000 benefit be taxable as income under this plan
Answers: 1
Do you know the correct answer?
Based on the density graph below, what is the probability of a value in the
sample space being anyw...
Questions in other subjects:

Physics, 13.12.2020 19:00


World Languages, 13.12.2020 19:00
Mathematics, 13.12.2020 19:00

Mathematics, 13.12.2020 19:10
Mathematics, 13.12.2020 19:10
English, 13.12.2020 19:10


