


The diagram shows a solid metal cuboid.
The areas of three of the faces are marked on
the dia...

Mathematics, 18.03.2021 03:40, briannamoreno12353
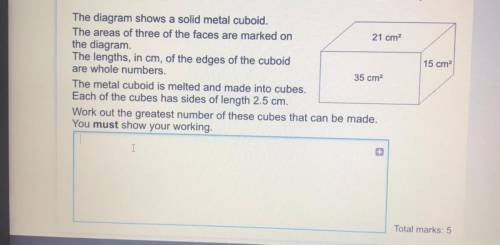
The diagram shows a solid metal cuboid.
The areas of three of the faces are marked on
the diagram.
The lengths, in cm, of the edges of the cuboid
are whole numbers.
The metal cuboid is melted and made into cubes.
Each of the cubes has sides of length 2.5 cm.
Work out the greatest number of these cubes that can be made.
You must show your working.

Answers: 2
Other questions on the subject: Mathematics
Mathematics, 21.06.2019 22:00, anastasiakonni1
Jayne is studying urban planning and finds that her town is decreasing in population by 3% each year. the population of her town is changing by a constant rate. true or false?
Answers: 3
Mathematics, 22.06.2019 01:20, blackboy21
1. why is a frequency distribution useful? it allows researchers to see the "shape" of the data. it tells researchers how often the mean occurs in a set of data. it can visually identify the mean. it ignores outliers. 2. the is defined by its mean and standard deviation alone. normal distribution frequency distribution median distribution marginal distribution 3. approximately % of the data in a given sample falls within three standard deviations of the mean if it is normally distributed. 95 68 34 99 4. a data set is said to be if the mean of the data is greater than the median of the data. normally distributed frequency distributed right-skewed left-skewed
Answers: 2
Do you know the correct answer?
Questions in other subjects:

Mathematics, 27.09.2019 15:30

Social Studies, 27.09.2019 15:30

Computers and Technology, 27.09.2019 15:30

Geography, 27.09.2019 15:30

Social Studies, 27.09.2019 15:30


