


1. The scatter plot shows the
relationship between the fat (grams)
and total calories in diff...

Mathematics, 18.03.2021 02:30, hallmansean04
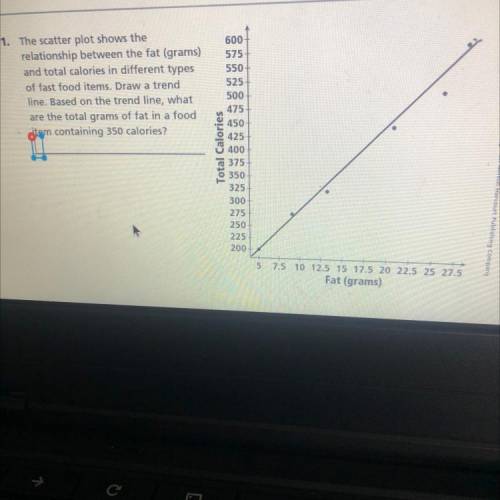
1. The scatter plot shows the
relationship between the fat (grams)
and total calories in different types
of fast food items. Draw a trend
line. Based on the trend line, what
are the total grams of fat in a food item containing 350 calories?

Answers: 1
Other questions on the subject: Mathematics
Mathematics, 21.06.2019 16:40, Hi123the
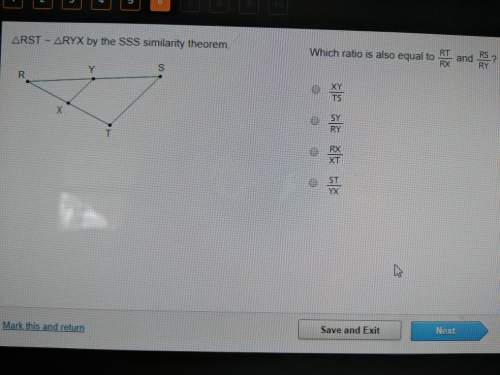
Which statement accurately explains whether a reflection over the y-axis and a 270° counterclockwise rotation would map figure acb onto itself? a coordinate plane with figure acb with point a at 1, 1, c at 3, 4 and b at 5, 1 yes, a″c″b″ is located at a″(1, 1), c″(4, 3), and b″(1, 5) yes, a″c″b′ is located at a″(1, 1), c″(3, 4), and b″(5, 1) no, a″c″b″ is located at a″(1, 1), c″(4, 3), and b″(1, 5) no, a″c″b″ is located at a″(1, 1), c″(3, 4), and b″(5, 1)
Answers: 2
Do you know the correct answer?
Questions in other subjects:
Mathematics, 31.01.2021 14:00


Mathematics, 31.01.2021 14:00
Mathematics, 31.01.2021 14:00
Physics, 31.01.2021 14:00

History, 31.01.2021 14:00
English, 31.01.2021 14:00
English, 31.01.2021 14:00


