


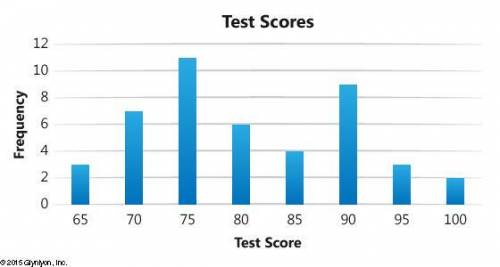
According to the bar graph below, what is the mode of the data set?
75
80
90
70
<...

Mathematics, 18.03.2021 02:10, aperez4102
According to the bar graph below, what is the mode of the data set?
75
80
90
70

Answers: 2
Other questions on the subject: Mathematics
Mathematics, 21.06.2019 22:30, scholarlystudenttt28
Which one is the correct answer, and why?
Answers: 1
Mathematics, 22.06.2019 00:30, genesis0523
What line represents the relationship between r and s
Answers: 1
Mathematics, 22.06.2019 02:00, ehaynie
Brittany has designed four different birdcages, each with the same volume: a square pyramid, a cylinder, a cone, and a sphere. the zoo wants to use one of brittany’s designs but plans to change the volume of the cage. find the design change that would result in the birdcage with the greatest volume. a.) increase the area of the base of the square pyramid by a factor of ten. b.) increase the height of the cylinder by a factor of ten. c.) increase the radius of the cone by a factor of ten. d.) increase the radius of a sphere by a factor of ten.
Answers: 1
Do you know the correct answer?
Questions in other subjects:

Biology, 24.10.2019 07:43

Geography, 24.10.2019 07:43

Mathematics, 24.10.2019 07:43
Mathematics, 24.10.2019 07:43
Mathematics, 24.10.2019 07:43


