

Mathematics, 18.03.2021 02:00, deontarr6853
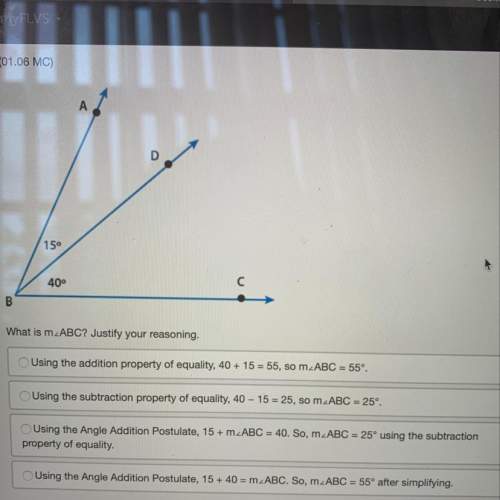
Use the graph in the picture to answer 2a & 2b:
2a. What is the maximum height of the tennis ball to the nearest tenth of a foot.
A.36.3 feet
B. 36.8 feet
C. 37.5 feet
D. 38.0 feet
2B. What does the x-coordinate of the vertex of the graph represent?
A. the maximum height of the tennis ball
B. The number of seconds the ball is in the air
C. the number of seconds the ball is in the air
D. the initial height of the tennis ball


Answers: 1


Other questions on the subject: Mathematics
Mathematics, 22.06.2019 05:40, kris7726
For a short time after a wave is created by wind , the height of the wave can be modeled using y= a sin 2pi(t) / t where a is the amplitude and t is the period of the wave in seconds. how many times over the first 5 seconds does the graph predict the wave to be 2 feet high?
Answers: 1
Mathematics, 22.06.2019 06:00, bluebug7316
For a research project in a political science course, a student has collected information about the quality of life and the degree of political democracy in 50 nations. specifically, she used infant mortality rates to measure quality of life and the percentage of all adults who are permitted to vote in national elections as a measure of democratization. her hypothesis is that the quality of life is higher in more democratic nations. read this research description carefully. pay attention to the following: how many variables are in this research? what is the scale of the variable for infant mortality? p1c4. what is the dependent variable in this research problem? p1c4. is this research descriptive or inferential? does this research involves single variable analysis or two or more variable analysis?
Answers: 3
Mathematics, 22.06.2019 06:50, lamondrairving
Van spent 10 minutes on his history homework and 3 minutes per question on his math homework. which graph thows the total homework time, t, related to the number of math questions, q? 1 2 3 4 5 6 7 8 1 2 3 4 5 6 7 8 1 1 2 3 4 5 6 7 8
Answers: 2
Do you know the correct answer?
Use the graph in the picture to answer 2a & 2b:
2a. What is the maximum height of the tennis ba...
Questions in other subjects:
Mathematics, 14.07.2019 09:30


