

Mathematics, 18.03.2021 01:40, fy1lqjh
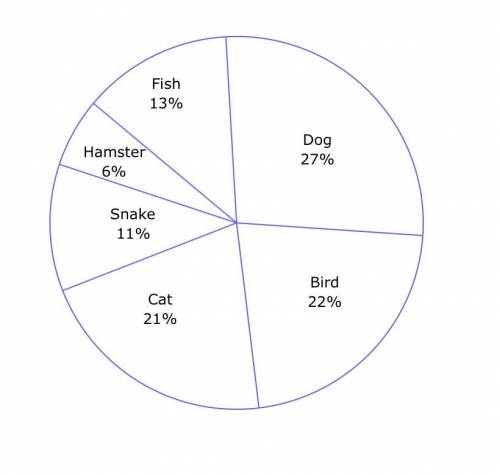
The citizens of a city were asked to choose their favorite type of pet. The circle graph shows how the citizens answered. If 140,000 citizens answered the question, how many chose Dog?

Answers: 2


Other questions on the subject: Mathematics
Mathematics, 21.06.2019 16:00, dswitz6604
Will give brainliest what is the value of x? enter your answer in the box.
Answers: 1
Mathematics, 21.06.2019 18:40, reggie1127
Christina can paint 420 square feet in 105 minutes. which unit rate describes the scenario?
Answers: 1
Mathematics, 21.06.2019 22:00, taliyahjhonson1
The birth weights of newborn babies in the unites states follow in a normal distrubution with a mean of 3.4 kg and standard deviation of 0.6 kg. reaserches interested in studying how. children gain weights decide to take random samples of 100 newborn babies and calculate the sample mean birth weights for each sample
Answers: 1
Do you know the correct answer?
The citizens of a city were asked to choose their favorite type of pet. The circle graph shows how t...
Questions in other subjects:


