

Mathematics, 18.03.2021 01:00, rah45
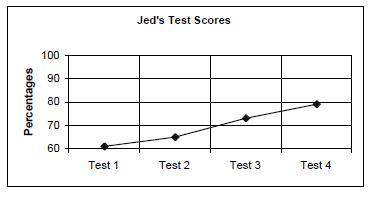
Explain what a graph for Jed’s test scores {61%, 65%, 73%, and 79%} would look like if it was not misleading. Make sure it is different than Jed’s graph – that some may say is misleading.

Answers: 3


Other questions on the subject: Mathematics
Mathematics, 21.06.2019 18:20, nehaljay1883
The first-serve percentage of a tennis player in a match is normally distributed with a standard deviation of 4.3%. if a sample of 15 random matches of the player is taken, the mean first-serve percentage is found to be 26.4%. what is the margin of error of the sample mean? a. 0.086% b. 0.533% c. 1.11% d. 2.22%
Answers: 1
Mathematics, 21.06.2019 18:50, potato3999
Aresearch group wants to find the opinions’ of city residents on the construction of a new downtown parking garage. what is the population of the survey downtown shoppers downtown visitors downtown workers city residents
Answers: 3
Do you know the correct answer?
Explain what a graph for Jed’s test scores {61%, 65%, 73%, and 79%} would look like if it was not mi...
Questions in other subjects:

English, 20.08.2019 09:00
Mathematics, 20.08.2019 09:00

Biology, 20.08.2019 09:00


Mathematics, 20.08.2019 09:00
Mathematics, 20.08.2019 09:00


