

Mathematics, 13.03.2021 21:40, scholar13
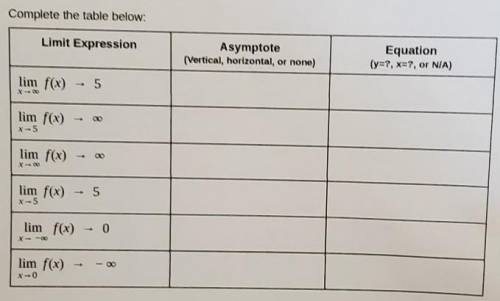
Hello! My teacher is asking us to find Horizontal and Vertical Asymptotes using a Limit Expression as is shown in the image attached. I'm not quite sure what to do. Can you maybe guide me through the steps of finding either a Horizontal or Vertical Asymptote using the Expressions provided? Thanks in advance!!!

Answers: 2


Other questions on the subject: Mathematics
Mathematics, 21.06.2019 19:00, emilyblaxton
Kayla and alberto are selling fruit for a school fundraiser. customers can buy small boxes of grapefruit and large boxes of grapefruit. kayla sold 3 small boxes of grapefruit and 1 large box of grapefruit for a total of $65. alberto sold 1 small box of grapefruit and 1 large box of grapefruit for a total of $55. what is the cost each of one small box of grapefruit and one large box of grapefruit?
Answers: 1
Mathematics, 21.06.2019 22:30, renaudciera
Use the following statements to write a compound statement for the conjunction or disjunction. then find its truth value. p: an isosceles triangle has two congruent sides. q: a right angle measures 90° r: four points are always coplanar. s: a decagon has 12 sides. a) a right angle measures 90° or an isosceles triangle has two congruent sides; true. b) a right angle measures 90° and an isosceles triangle has two congruent sides; true. c) a right angle measures 90° and an isosceles triangle does not have two congruent sides; false. d) a right angle measures 90° or an isosceles triangle does not have two congruent sides; true.
Answers: 3
Mathematics, 22.06.2019 00:30, trujillo03
1.3.25 question suppose 40​% of all voters voted for a particular candidate. to simulate exit polls regarding whether or not voters voted for this​ candidate, five random samples of size 1010 and five random samples of size 10001000 have been generated using technology using a population proportion of 0.400.40​, with the accompanying results. complete parts a through c below. click the icon to view the simulation results. a. observe how the sample proportions of successes vary around 0.400.40. simulation compared to sample prop simulation compared to sample prop 1 ▾ 6 ▾ greater than 0.40 less than 0.40 equal to 0.40 2 ▾ less than 0.40 greater than 0.40 equal to 0.40 7 ▾ greater than 0.40 less than 0.40 equal to 0.40 3 ▾ greater than 0.40 less than 0.40 equal to 0.40 8 ▾ equal to 0.40 greater than 0.40 less than 0.40 4 ▾ greater than 0.40 equal to 0.40 less than 0.40 9 ▾ less than 0.40 greater than 0.40 equal to 0.40 5 ▾ equal to 0.40 less than 0.40 greater than 0.40 10 ▾ equal to 0.40 greater than 0.40 less than 0.40 click to select your answer(s) and then click check answer. 2 parts remaining clear all check answer
Answers: 3
Mathematics, 22.06.2019 01:00, AvaHeff
The stem-and-leaf plot shows the heights in centimeters of teddy bear sunflowers grown in two different types of soil. soil a soil b 5 9 5 2 1 1 6 3 9 5 1 0 7 0 2 3 6 7 8 2 1 8 3 0 9 key: 9|6 means 69 key: 5|8 means 58 calculate the mean of each data set. calculate the mean absolute deviation (mad) of each data set. which set is more variable? how do you know?
Answers: 2
Do you know the correct answer?
Hello! My teacher is asking us to find Horizontal and Vertical Asymptotes using a Limit Expression a...
Questions in other subjects:
Mathematics, 17.10.2020 22:01
Mathematics, 17.10.2020 22:01

Mathematics, 17.10.2020 22:01

Social Studies, 17.10.2020 22:01
Mathematics, 17.10.2020 22:01

Mathematics, 17.10.2020 22:01


