

Mathematics, 13.03.2021 05:50, tatemcgee
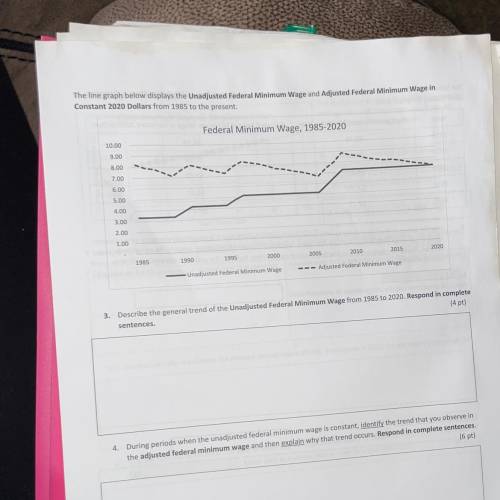
The line graph below displays the Unadjusted Federal Minimum Wage and Adjusted Federal Minimum Wage in
Constant 2020 Dollars from 1985 to the present.
Federal Minimum Wage, 1985-2020
10.00
9.00
8.00
7.00
6.00
5.00
4.00
3.00
2.00
100
2015
2020
2005
2010
2000
1995
1985
1990
--- Adjusted Federal Minimum Wage
-Unadjusted Federal Minimum Wage
3. Describe the general trend of the Unadjusted Federal Minimum Wage from 1985 to 2020. Respond in complete
sentences.
(4 pt)
4. During periods when the unadjusted federal minimum wage is constant, identify the trend that you observe in
the adjusted federal minimum wage and then explain why that trend occurs. Respond in complete sentences.
(6 pt)
175

Answers: 1


Other questions on the subject: Mathematics
Mathematics, 21.06.2019 16:30, xxaurorabluexx
If g(x) is an odd function, which function must be an even function?
Answers: 3
Mathematics, 21.06.2019 17:30, victordhernandez01
Nick and nora are married and have three children in college. they have an adjusted gross income of 47,400. if their standard deduction is 12,600 itemized deductions are 14,200 and they get an exemption of 4000 for each adult and each dependent what is their taxable income
Answers: 3
Do you know the correct answer?
The line graph below displays the Unadjusted Federal Minimum Wage and Adjusted Federal Minimum Wage...
Questions in other subjects:

Geography, 03.10.2021 14:00

Social Studies, 03.10.2021 14:00

Physics, 03.10.2021 14:00


Biology, 03.10.2021 14:00


Advanced Placement (AP), 03.10.2021 14:00
Biology, 03.10.2021 14:00

Chemistry, 03.10.2021 14:00


