

Mathematics, 12.03.2021 18:10, shalynmincey
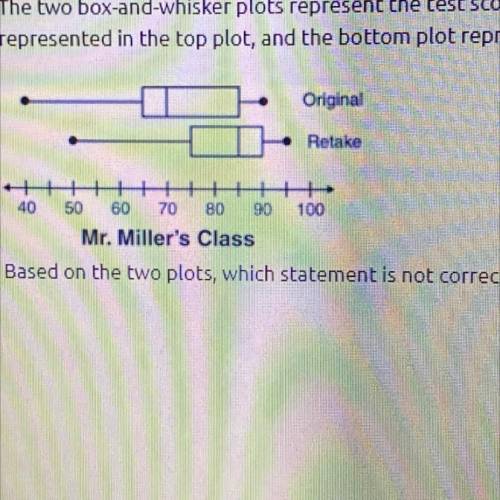
The two box-and-whisker plots represent the test scores in Mr. Miller's class. The original test scores are
represented in the top plot, and the bottom plot represents the retake scores.
Based on the two plots, which statement is not correct?
A. There were 25% of the students who scored below a 75 on the retake test
B. The range for both sets of score is the same
C. The median score on the retake test appears to be about 15 points higher than on the original test
D. On average, the students earned higher scores on the retake test

Answers: 3


Other questions on the subject: Mathematics
Mathematics, 21.06.2019 15:30, yourgirlnevaeh
Evaluate-27 ^4/3/8 a) - 81/16 b) 81/16 c) 16/81
Answers: 2
Mathematics, 21.06.2019 16:00, codycollier
Which rational number could be graphed between -4 and -5
Answers: 1
Mathematics, 21.06.2019 19:00, william03300
Aflower has 26 chromosomes. to create a new flower, how many would a sperm cell have what is called?
Answers: 1
Do you know the correct answer?
The two box-and-whisker plots represent the test scores in Mr. Miller's class. The original test sco...
Questions in other subjects:

Social Studies, 25.03.2020 16:22


Geography, 25.03.2020 16:23

History, 25.03.2020 16:24


