

Mathematics, 12.03.2021 06:50, eayoungin
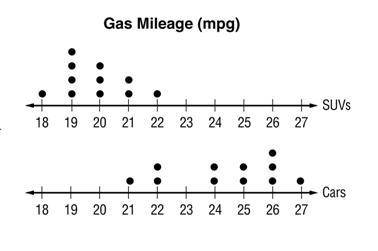
Compare the centers and variations of the two populations. Round to the nearest tenth if necessary. Write an inference you can draw about the two populations.
GAS MILEAGE The double dot plot shows the gas mileage, in miles per gallon, for several cars and SUVs.
a. The median for the SUV data is 25 with a variation of 4. The median for the car data is 20 with a variation of 2. SUVS have a greater gas mileage with a greater variation.
b. The median for the SUV data is 28 with a variation of 2. The median for the car data is 25 with a variation of 4. SUVS have a greater gas mileage with a greater variation.
c. The median for the SUV data is 20 with a variation of 2. The median for the car data is 25 with a variation of 4. Cars have a greater gas mileage with a greater variation.
d. The median for the SUV data is 32 with a variation of 2. The median for the car data is 25 with a variation of 4. Cars have a greater gas mileage with a less variation.

Answers: 1


Other questions on the subject: Mathematics
Mathematics, 21.06.2019 13:00, MIYAISSAVGE2409
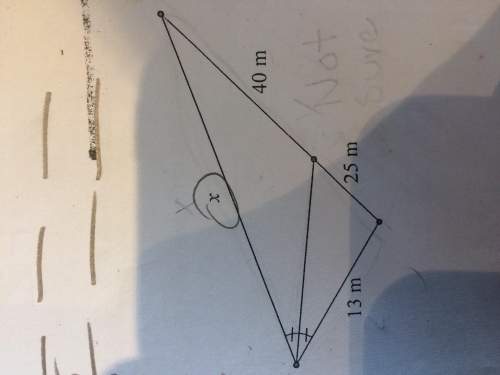
Fine the area of the kite. a. 90 sq. units b. 9 sq. units c. 180 sq. units d. 45 sq. units
Answers: 1
Mathematics, 21.06.2019 17:10, Playboycxm
Consider the following equation -167 + 37 = 49 - 21p select the equation that has the same solution as the given equation. o a. p - 5 + ip = 7 - p ob. +55 + 12p = 5p + 16 c. 2 + 1.25p = -3.75p + 10 d. -14 + 6p = -9 - 6p reset next
Answers: 3
Mathematics, 21.06.2019 17:30, atkinsonsinbraz
One integer is 8 times another. if the product is 72, then find the integers
Answers: 2
Do you know the correct answer?
Compare the centers and variations of the two populations. Round to the nearest tenth if necessary....
Questions in other subjects:

English, 08.03.2021 21:10

Health, 08.03.2021 21:10
Mathematics, 08.03.2021 21:10

Biology, 08.03.2021 21:10
Mathematics, 08.03.2021 21:10

Mathematics, 08.03.2021 21:10
Health, 08.03.2021 21:10


