Mathematics, 12.03.2021 01:00, yair7
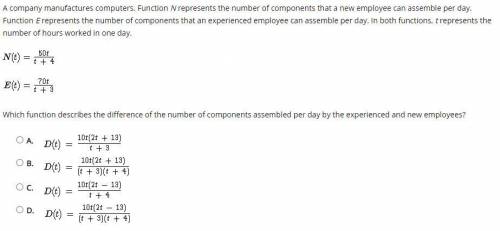
A company manufactures computers. Function N represents the number of components that a new employee can assemble per day. Function E represents the number of components that an experienced employee can assemble per day. In both functions, t represents the number of hours worked in one day. Which function describes the difference of the number of components assembled per day by the experienced and new employees?


Answers: 3
Other questions on the subject: Mathematics

Mathematics, 21.06.2019 17:00, liddopiink1
Find the area of a parallelogram with the given vertices. p(-2, -5), q(9, -5), r(1, 5), s(12, 5)
Answers: 1


Mathematics, 22.06.2019 02:40, jake9919
Kilgore trout creates a new scale to diagnose depression. however, his scale only assesses one symptom of depression while ignoring others. which of the following is his new scale most likely lacking? a) test-retest reliability b) discriminant validity c) criterion validity d) alternate-forms reliability e) content validity f) none of the above
Answers: 1

Mathematics, 22.06.2019 03:00, dominiqueallen23
Describe how the presence of possible outliers might be identified on the following. (a) histograms gap between the first bar and the rest of bars or between the last bar and the rest of bars large group of bars to the left or right of a gap higher center bar than surrounding bars gap around the center of the histogram higher far left or right bar than surrounding bars (b) dotplots large gap around the center of the data large gap between data on the far left side or the far right side and the rest of the data large groups of data to the left or right of a gap large group of data in the center of the dotplot large group of data on the left or right of the dotplot (c) stem-and-leaf displays several empty stems in the center of the stem-and-leaf display large group of data in stems on one of the far sides of the stem-and-leaf display large group of data near a gap several empty stems after stem including the lowest values or before stem including the highest values large group of data in the center stems (d) box-and-whisker plots data within the fences placed at q1 â’ 1.5(iqr) and at q3 + 1.5(iqr) data beyond the fences placed at q1 â’ 2(iqr) and at q3 + 2(iqr) data within the fences placed at q1 â’ 2(iqr) and at q3 + 2(iqr) data beyond the fences placed at q1 â’ 1.5(iqr) and at q3 + 1.5(iqr) data beyond the fences placed at q1 â’ 1(iqr) and at q3 + 1(iqr)
Answers: 1
Do you know the correct answer?
A company manufactures computers. Function N represents the number of components that a new employee...
Questions in other subjects:

Mathematics, 20.09.2021 08:40


Mathematics, 20.09.2021 08:40

Mathematics, 20.09.2021 08:40


Health, 20.09.2021 08:40

Geography, 20.09.2021 08:40


