

Mathematics, 11.03.2021 21:20, IkarosSakurai
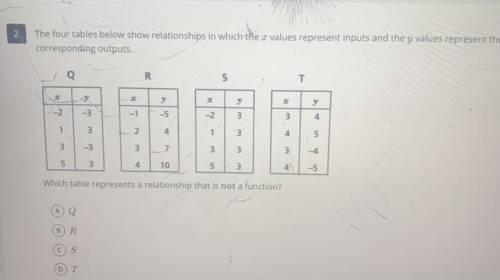
The four tables below show relationships in which the a values represent inputs and the y values represent the
corresponding outputs,
R
S
T
y
y
2
y
1-2
-3
-1
-5
-2
3
3
4
1
3
2
4
1
3
4
5
3
-3
3
7
3
3
3
-4
5
3
4
10
5
3
4
-5
Which table represents a relationship that is not a function?
A Q
B
R
D

Answers: 1


Other questions on the subject: Mathematics
Mathematics, 21.06.2019 19:30, MagicDragon4734
Which of the points a(6, 2), b(0, 0), c(3, 2), d(−12, 8), e(−12, −8) belong to the graph of direct variation y= 2/3 x?
Answers: 2
Do you know the correct answer?
The four tables below show relationships in which the a values represent inputs and the y values rep...
Questions in other subjects:

English, 24.06.2021 15:00
Mathematics, 24.06.2021 15:10
Mathematics, 24.06.2021 15:10


