

Mathematics, 11.03.2021 19:40, johnny08
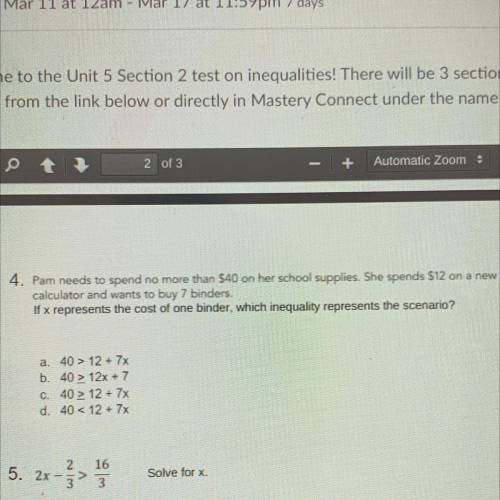
Pam needs to spend no more than 540 on her school supplies. She spends 512 on a new
calculator and wants to buy 7 binders.
If x represents the cost of one binder, which inequality represents the scenario?

Answers: 3


Other questions on the subject: Mathematics
Mathematics, 20.06.2019 18:04, ashleypaz15
Students buying lunch at rockwell elementary school yesterday chose either burritos or pizza. 185 students chose burritos and 252 chose pizza. 1. estimate the number of students who brought lunch by rounding each number to the nearest hundred. 2. estimate how many students bought lunch by rounding each number to the nearest ten. 3. find the total number of students who brought lunch. which of your estimates is closer to the actual total? explain. 4. draw a figure on a sheet of paper. estimate how many pennies will fit inside the figure. check your prediction using pennies.
Answers: 1
Mathematics, 21.06.2019 15:00, tejasheree
Flashback to semester a. are triangles pqr and stu congruent? what is the congruency that proves they are congruent? what is the perimeter of triangle pqr? show your work.
Answers: 2
Mathematics, 21.06.2019 16:00, kell22wolf
Part one: measurements 1. measure your own height and arm span (from finger-tip to finger-tip) in inches. you will likely need some from a parent, guardian, or sibling to get accurate measurements. record your measurements on the "data record" document. use the "data record" to you complete part two of this project. name relationship to student x height in inches y arm span in inches archie dad 72 72 ginelle mom 65 66 sarah sister 64 65 meleah sister 66 3/4 67 rachel sister 53 1/2 53 emily auntie 66 1/2 66 hannah myself 66 1/2 69 part two: representation of data with plots 1. using graphing software of your choice, create a scatter plot of your data. predict the line of best fit, and sketch it on your graph. part three: the line of best fit include your scatter plot and the answers to the following questions in your word processing document 1. 1. which variable did you plot on the x-axis, and which variable did you plot on the y-axis? explain why you assigned the variables in that way. 2. write the equation of the line of best fit using the slope-intercept formula $y = mx + b$. show all your work, including the points used to determine the slope and how the equation was determined. 3. what does the slope of the line represent within the context of your graph? what does the y-intercept represent? 5. use the line of best fit to you to describe the data correlation.
Answers: 2
Do you know the correct answer?
Pam needs to spend no more than 540 on her school supplies. She spends 512 on a new
calculator and...
Questions in other subjects:

English, 17.07.2019 08:00

Biology, 17.07.2019 08:00

History, 17.07.2019 08:00

Health, 17.07.2019 08:00


