

Mathematics, 11.03.2021 06:30, Greatthinker2000
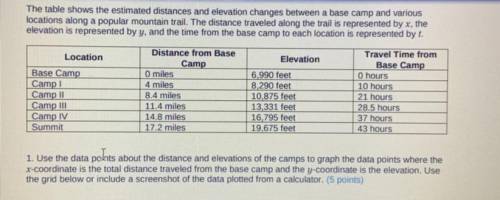
The table shows the estimated distances and elevation changes between a base camp and various
locations along a popular mountain trail. The distance traveled along the trail is represented by x, the
elevation is represented by y, and the time from the base camp to each location is represented by t.
1. Use the data points about the distance and elevations of the camps to graph the data points where the
x-coordinate is the total distance traveled from the base camp and the y-coordinate is the elevation. Use
the grid below or include a screenshot of the data plotted from a calculator. (5 points)

Answers: 3


Other questions on the subject: Mathematics
Mathematics, 21.06.2019 18:00, Sanchezj104
Marla bought a book for $12.95, a binder for $3.49, and a backpack for $44.99. the sales tax rate is 6%. find the amount of tax and the total she paid for these items
Answers: 3
Mathematics, 22.06.2019 02:00, laurachealsy923
Zack and tia played chess for 50 min they put the chessboard away at 11: 20 when did they start
Answers: 1
Mathematics, 22.06.2019 04:00, lulabelles7750
Brad earns $12.75/hr and works 40 hours a week. what is his gross annual income?
Answers: 1
Do you know the correct answer?
The table shows the estimated distances and elevation changes between a base camp and various
locat...
Questions in other subjects:
Mathematics, 07.01.2022 04:00


Business, 07.01.2022 04:00
Mathematics, 07.01.2022 04:10
Mathematics, 07.01.2022 04:10

History, 07.01.2022 04:10


