

Mathematics, 10.03.2021 23:10, lagarde
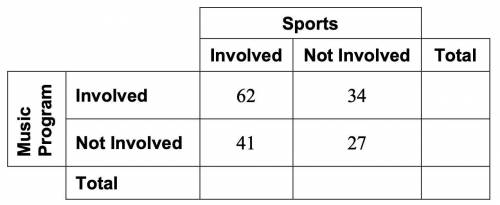
You randomly survey students about their involvement in school sports and the school music program. The two-way table shows the results.
Review the two-way frequency table below and complete it on your work page. Then answer the following:
Questions:
1. How many students were surveyed in total?
2. Out of the total number of students, what percentage are not involved in either sports or music?
3. If a student is involved in sports, what is the probability that he/she is also involved in the music program?
Pls explain how you got the answer.

Answers: 1


Other questions on the subject: Mathematics
Mathematics, 21.06.2019 19:00, ortizprecious5183
How do the definitions, properties, and postulates you've learned about line segments, parallel lines, and angles to define the shapes of polygons
Answers: 1
Mathematics, 21.06.2019 22:30, clickbaitdxl
Pls never taught i’m really confused and i rlly need
Answers: 1
Mathematics, 22.06.2019 02:30, sassycutie523
The upcoming championship high school football game is a big deal in your little town. the problem is, it is being played in the next biggest town, which is two hours away! to get as many people as you can to attend the game, you decide to come up with a ride-sharing app, but you want to be sure it will be used before you put all the time in to creating it. you determine that if more than three students share a ride, on average, you will create the app. you conduct simple random sampling of 20 students in a school with a population of 300 students to determine how many students are in each ride-share (carpool) on the way to school every day to get a good idea of who would use the app. the following data are collected: 6 5 5 5 3 2 3 6 2 2 5 4 3 3 4 2 5 3 4 5 construct a 95% confidence interval for the mean number of students who share a ride to school, and interpret the results. part a: state the parameter and check the conditions. part b: construct the confidence interval. be sure to show all your work, including the degrees of freedom, critical value, sample statistics, and an explanation of your process. part c: interpret the meaning of the confidence interval. part d: use your findings to explain whether you should develop the ride-share app for the football game.
Answers: 3
Do you know the correct answer?
You randomly survey students about their involvement in school sports and the school music program....
Questions in other subjects:


Social Studies, 21.04.2020 17:00

Mathematics, 21.04.2020 17:00

English, 21.04.2020 17:00


