

Mathematics, 10.03.2021 21:00, Geo777
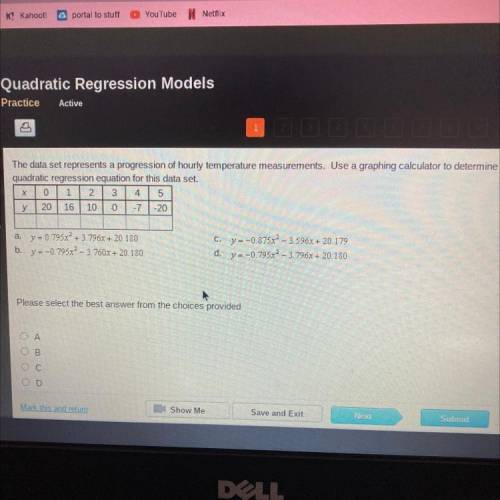
The data set represents a progression of hourly temperature measurements. Use a graphing calculator to determine the
quadratic regression equation for this data set
O 1 2 3
5
у 20 16 10 0 -7 -20
X
4
ay-0.795x2 + 3 796% + 20.130
b. y -0.7957-3760% + 20.120
C. y -0.8757 -3.9962 + 20.179
dy-0.7957 - 3.7962 * 20.120

Answers: 3


Other questions on the subject: Mathematics
Mathematics, 21.06.2019 23:00, Nathaliasmiles
Charlie tosses five coins. what is the probability that all five coins will land tails up.
Answers: 2
Mathematics, 22.06.2019 00:00, jetskiinbunny31
The statements below can be used to prove that the triangles are similar. ? △abc ~ △xyz by the sss similarity theorem. which mathematical statement is missing? ∠b ≅ ∠y ∠b ≅ ∠z
Answers: 2
Do you know the correct answer?
The data set represents a progression of hourly temperature measurements. Use a graphing calculator...
Questions in other subjects:

History, 07.04.2021 18:50

Chemistry, 07.04.2021 18:50
Mathematics, 07.04.2021 18:50

English, 07.04.2021 18:50
Mathematics, 07.04.2021 18:50


