

Mathematics, 28.10.2019 22:31, bluehaze
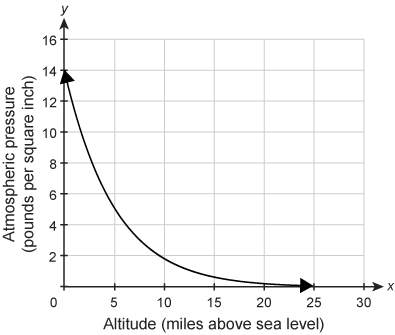
The graph represents the atmospheric pressure in pounds per square inch as a function of altitude in mi above the sea level. which statements accurately reflect this relationship? select each correct answer.
the atmospheric pressure is lower at 15 miles above sea level than at 10 miles above sea level.
as the altitude increases, the atmospheric pressure increases.
the atmospheric pressure is 14 pounds per square inch at sea level.
as the altitude approaches sea level, the atmospheric pressure increases.
the atmospheric pressure gets close to 14 pounds per square foot as the altitude continues to increase.

Answers: 3


Other questions on the subject: Mathematics
Mathematics, 21.06.2019 23:30, jadenweisman1
The approximate line of best fit for the given data points, y = −2x − 2, is shown on the graph. which is the residual value when x = –2? a)–2 b)–1 c)1 d)2
Answers: 2
Do you know the correct answer?
The graph represents the atmospheric pressure in pounds per square inch as a function of altitude in...
Questions in other subjects:


Mathematics, 17.11.2020 17:10


