


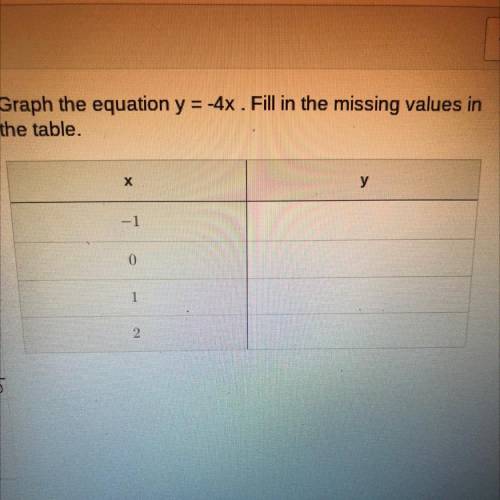
Graph the equation y = -4x. Fill in the missing values in
the table.
...

Mathematics, 10.03.2021 17:30, hilarydodard7099
Graph the equation y = -4x. Fill in the missing values in
the table.

Answers: 1
Other questions on the subject: Mathematics
Mathematics, 21.06.2019 13:30, sarahsteelman
Rose drew a regression line for this paired data set. her line passed through (1, 2) and (3, 5) . what is the equation of rose's regression line?
Answers: 1
Mathematics, 21.06.2019 15:30, groverparham3
Is each relation a function? if so, state whether it is one-to-one or many-to-one. 3. (-4,7), (-3,5), (1,4), (3,-8), (5,-11) 4. (-4,8), (-2,4), (0,1), (2,4), (4,8) 5. (-2, 1), (-2,3), (0,-3), (1,4), (3,1)
Answers: 3
Mathematics, 21.06.2019 15:40, 1tallison1
What is the first quartile of this data set? 10, 11, 12, 15, 17, 19, 22, 24, 29, 33, 38 a. 12 b. 19 c. 29 d. 10
Answers: 1
Mathematics, 21.06.2019 17:00, marciekinser
Solve with work adding cheese to a mcdonalds quarter pounder increases the fat content from 21g to 30g. what is the percent of change ?
Answers: 2
Do you know the correct answer?
Questions in other subjects:


Advanced Placement (AP), 29.10.2020 17:00

Mathematics, 29.10.2020 17:00


Health, 29.10.2020 17:00


